
The screen shows $5000, then $4000, and $1000 a month later.
That’s your profits from the stock market, shrinking fast. You start to panic. You feel sick to your stomach. You blame yourself for not cashing in earlier.
Maybe it is dumb luck. Maybe it is a lack of skill. Whichever the reason, you don’t wish to experience a huge drop in profits. You want to protect more of your profits.
“Are there ways to trade the stock market with less risk?” you ask yourself. You begin on a quest which brought you here.
Before you jump right in to the strategy, I strongly encourage you to read this article in order. You may want to save this article as you digest its content.
Welcome to learning all about swing trading!
Stock Market For Dummies
The stock market is a place where people buy and sell shares of companies (eg. CBOE, AMEX, NASDAQ, and NYSE). At times, you’d hear someone referring to the S&P 500 as the US stock market. The S&P 500 is a market index which is way smaller than the broad market for stocks.

Buying and selling of shares used to be done physically or through a human broker. As technology advances, stocks can be traded over the Internet.
The benefits of trading stocks over the Internet include instantaneous transactions, reduced transaction costs, and the release of timely information to the public.
With the many advantages technology has brought, does it mean that making money from the stock market is easy?
Who participates in the stock market? Retail traders (like you and I), corporate investors, fund managers, and government are participants of the stock market.
Retail traders (that’s you and I) are the people with the least cash and significance in the stock market. This is true unless you can command an army of Redditors. Ok, jokes aside. It pays to follow what the big boys (corporate investors, fund managers, and governments) are doing. How? By following the trend.
You can follow the trend using a few methods. Swing trading is one of the ways and you’ll discover more about it below.
What Is Swing Trading?
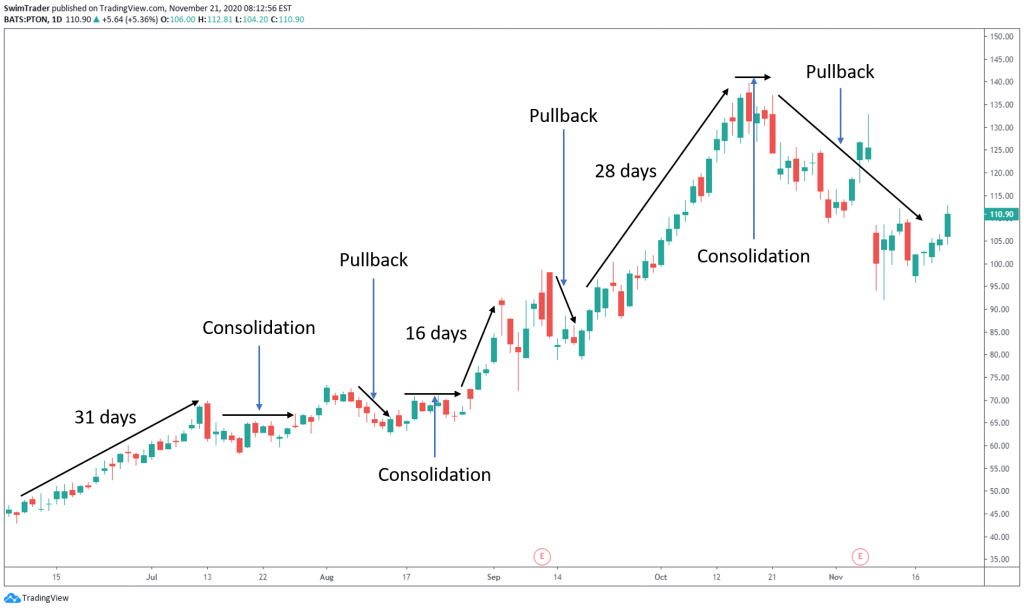
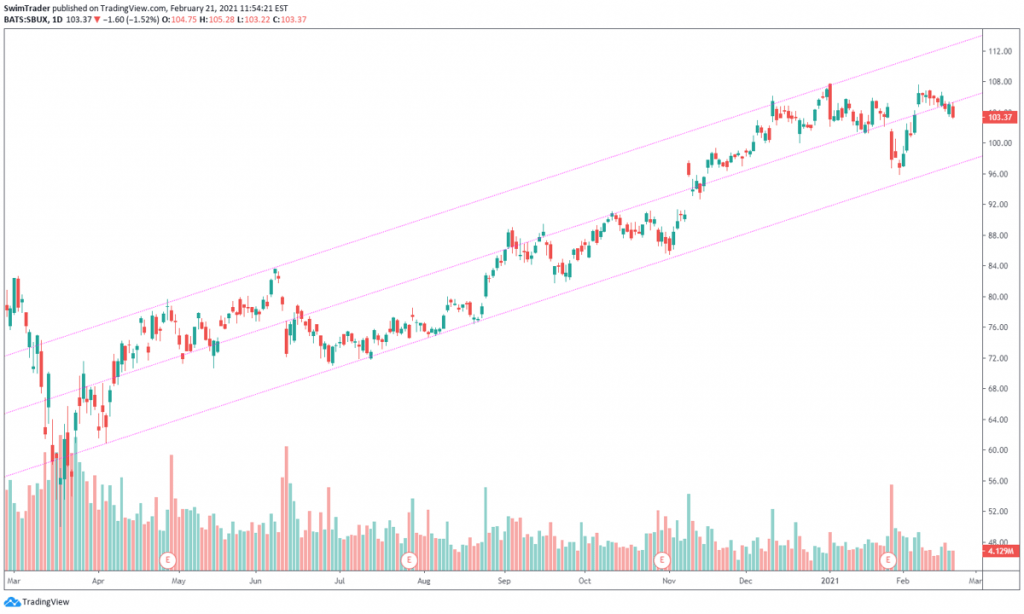
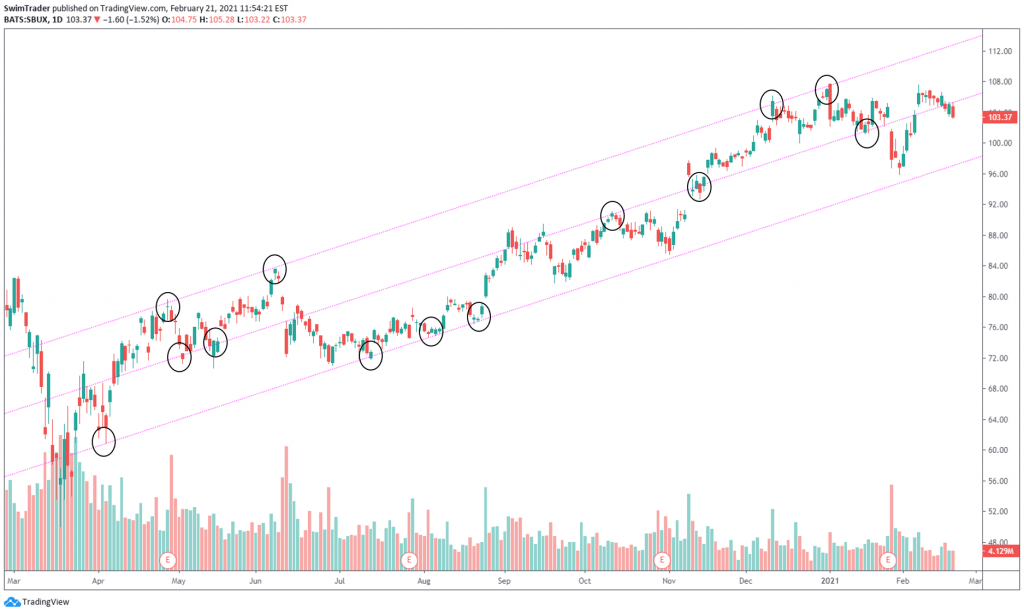
Swing trading is a strategy that follows the trend of prices. Prices in the stock market don’t rise indefinitely. Prices can pause by fluctuating around a level, or decline.
In a bull market (where prices are on the rise), a swing is an upward move. This can last for minutes to weeks, depending on the timeframe of the chart you are looking at.
The downward moves in a bull market are known as pullbacks (aka corrections). Pullbacks tend to be swifter than swings and are usually about 10% deep.
In a bear market (where prices on the decline), a swing is a downward move. A pullback is an upward move and it tends to be swifter than swings (just like the ones in a bull market). Pullbacks in a bear market are stronger at about 15 to 20%.
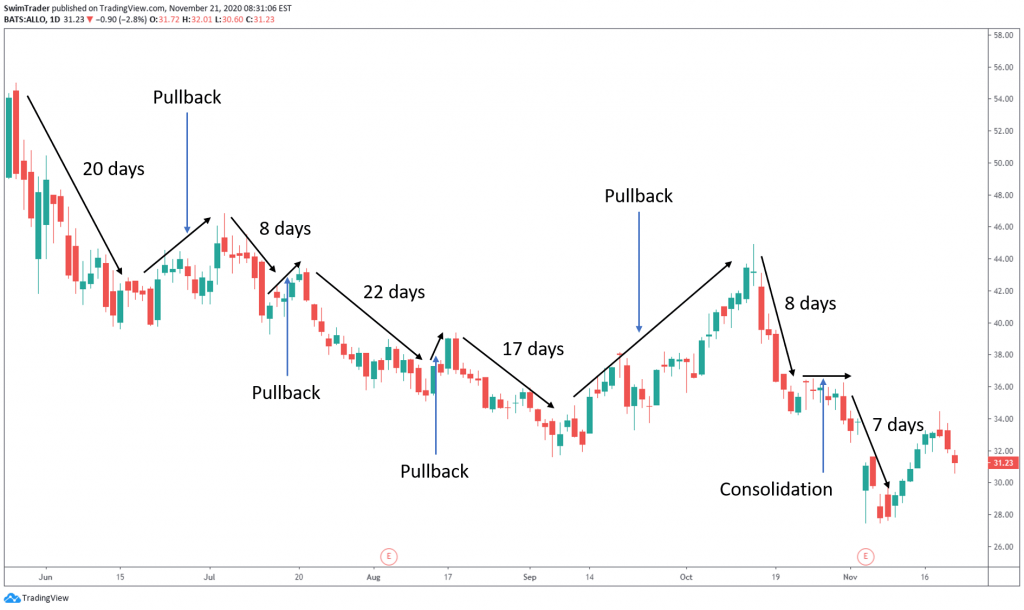
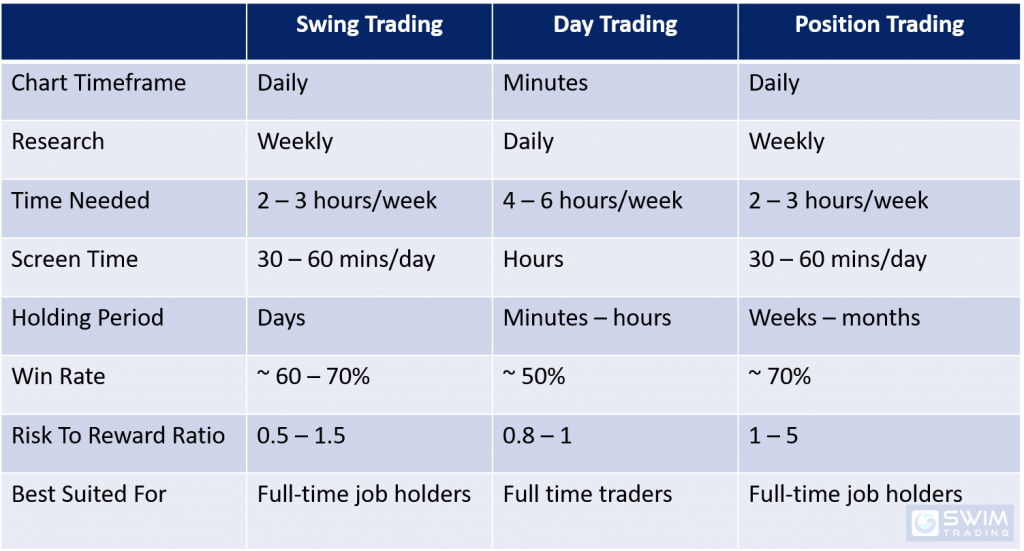
Is swing trading bound to a timeframe? No, swing trading is not limited to or defined by a timeframe, unlike day trading which lasts for less than a day or position trading which lasts for weeks and longer.
You can even apply the techniques of swing trading to your day trades! But for simplicity, I’ll refer to the daily timeframe throughout this article.
Before you proceed, if there is any terminology that you are unsure of, you may search for it in our trading glossary. It is filled with illustrations and examples to help you understand concepts at the snap of a finger.
Who Is Swing Trading Suitable For?
In the previous section, you’ve learnt about what swing trading is.
Swing trading isn’t limited to a particular timeframe. It is a strategy which can be applied on all timeframes.
For simplicity, I’ll refer to the daily timeframe throughout this article.

Swing trading is for you if:
#1 You don’t wish to sit in front of your computer for long hours to watch the stock market
#2 You wish to buy and hold for a few days to weeks
#3 You have 2 hours over the weekends to plan your trades
#4 You have 30 mins every weekday to monitor the stock market and enter your trades
#5 Even if you are a total beginner
If you are living in Asia, you’ll love swing trading the US stock market. This is because you can hold a full-time day job and swing trade at night, like many of the members in our Facebook Group.
As with any forms of investments, please don’t trade if you are in financial distress.
Swing Trading vs Day Trading vs Position Trading
Ok, you know that swing trading can be in the minutes to weeks. You also know that I’ll be using the daily chart timeframe as the default.
But what is day trading? What is position trading? Swing trading will be compared to day trading and position trading to help you find your trading style and navigate the world of stock trading.
Day trading is a form of trading where you go Long or Short and close your trade by the end of the same trading day.
Going Long means that you buy a stock in anticipation that its price will rise and selling it at a higher price, pocketing the price difference. Going Short (or short-selling) is done by selling a stock in anticipation that its price will drop and buying it back at a cheaper price, pocketing the price difference.
You’ll have to check if your broker allows you to engage in short-selling as this isn’t made available for all brokers.
Position trading is a form of trading (Long or Short) which usually lasts for weeks and months.
To help you compare swing trading vs day trading vs position trading at a glance, I’ve created a table.
Market Research
You can leave your market research to the weekend for swing trading and position trading. That’ll take you about 2 hours each week.
On the other hand, you’ll need to spend about an hour each day (before the stock markets open) to scour for news that will affect the markets if you day trade.
Screen Time

As a swing trader, you’ll just need to spend between 30 and 60 minutes a day to watch the market and enter your trades. A position trader will also require the same amount of screen time.
However, a day trader needs to be glued to his screen as opportunities may flash by in an instant and be gone in another.
Holding Period
Since you’ll be looking for opportunities using the daily timeframe, your holding period as a swing trader will be in the days or longer.
A position trader looks to ride the longer term trend, hence his holding period tends to be longer – from weeks to months.
A day trader will only want to hold his trade in minutes to hours as he plans to exit by the end of the trading day.
Risk To Reward Ratio
I know. You are wondering if there is a typo error in the Risk To Reward Ratio column. Shouldn’t your risk to reward ratio be equal to or less than 1?
A swing is an upward move in a bull market, and a downward move in a bear market. This means that you’ll be following the trend. If the stock market is in an uptrend, the upswings tend to be longer than the corrections.
In a bear market, the downswings tend to be longer than the corrections. Hence, you can expect the swings to last longer than the corrections.
You’ll also want to capture as much as the swing as possible. This means that swings can take several days to weeks to be completed. And prices don’t move in a straight line; they move in waves.
This means that if you have a tight stop loss to enhance your risk to reward ratio, you run the risk of getting stopped out prematurely if prices dip for a while before moving towards your profit target. The end result of this? A losing trade which could’ve gone you way if you had given your stock more breathing space. This will ultimately impact your trading results negatively and shatter your confidence.
Is there a reliable indicator to help you avoid getting stopped out prematurely? Find out about this reliable indicator and how you can use it to make money by clicking here.
What Can You Swing Trade?
You can swing trade almost anything that’s made available by your broker. This means you can swing trade cryptocurrencies, commodities, currencies, ETFs, indices, and stocks.
There are just 2 criteria:
#1 Established price history
#2 Trend
Newly listed instruments don’t have an established price history. Without much price history, it is difficult to conduct technical and fundamental analysis to predict how the instrument will behave in the near future.
Here’s an example:
SNOW was listed on 16 Sep 2020. That’s only 4 months ago.
There isn’t enough price history to plot the necessary support and resistance zones, trendlines and more. Don’t know what support and resistance and/or trendlines are? No worries. They will be covered in Part 2.
If a stock or instrument has been moving sideways or without a clear trend, it is not a candidate for swing trading.
Here’s an example:
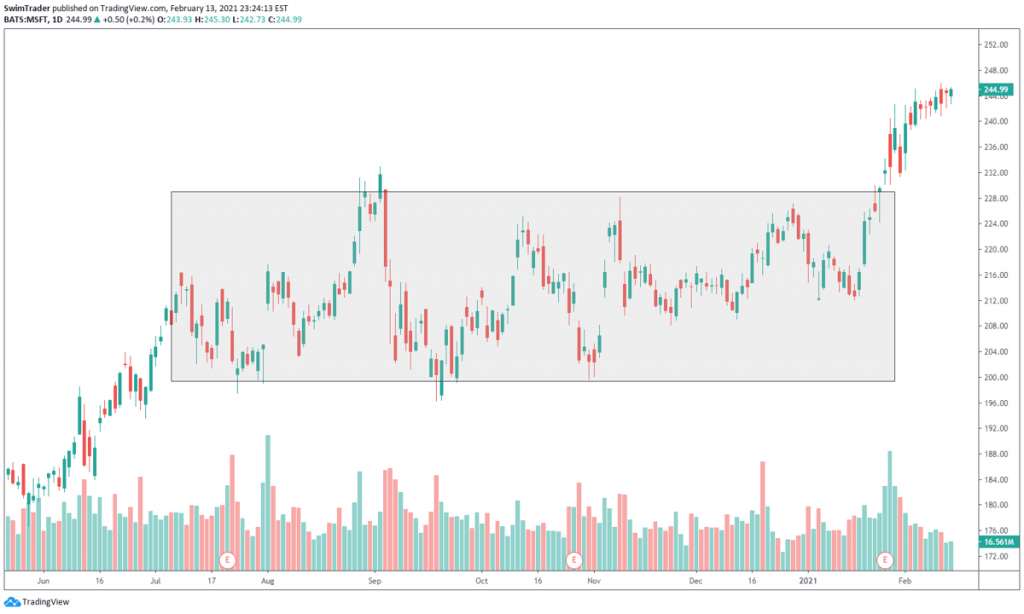
The price of MSFT began to range in early Jul 2020. This ranging motion ended only in late Jan 2021. That’s 7 whole months!
If you had tried to swing trade MSFT during that period, you’d feel super frustrated because you’d make some money, only to see the profits evaporate and trigger your stop loss. If you’re lucky, you would’ve made some money.
However, your confidence would’ve been badly hit. When you are low in confidence, you question your judgement. You will be fearful. When an excellent trading opportunity shows up, you’ll be hesitant and your brain will play games with you. That’s a downward spiral which no trader wants to go through.
If you are new to trading US stocks. the next section is for you.
Which Broker Should You Use?
Please note that this section is accurate as of Nov 2020.
There are 11 main considerations to help you select a good broker.
#1 Brokerage Type

When you buy an instrument, some brokers hold it for you under your name. Others hold it in custody for you.
The broker which holds your instruments in custody isn’t as safe because this means that your investments are only safe if the broker doesn’t shut down. This hasn’t happened in Singapore so far, and let’s keep it this way.
Other brokers offer a unique product called Contracts for Difference (CFD).
A CFD is a derivative. It can be a derivative of stocks, indices, commodities, and so on. In this article, I shall limit it to stocks.
A CFD is also a leveraged financial product. The leverage provided ranges from 5 times to 20 times, depending on the instrument. The usual leverage for stocks is 10 times.
Leverage is a double-edged sword. An educated and seasoned trader will be able to capitalize on the leverage to grow his trading account by up to 10 times.
Losses are also magnified when leverage is used. Hence, the horror stories where traders had losses that were much larger than their trading account. I’m sure you’ve heard about the tragedy of Alex Kearns who owed his broker more than USD700,000 from trading Options (an exotic and highly leveraged product).
But, if you are an educated and seasoned trader, you’ll want to make use of leverage.
#2 Regulation

It’s in your best interest to know if the broker you’d like to use is regulated in your home country and in
other countries where the laws are strict. This will provide you with an avenue to seek redress if your broker is dishonest.
I’ve done the research and listed it down for you in a table at the end of this article.
#3 Demo Account
Having a demo account is beneficial as it’ll allow you to have a tour of your broker’s trading platform.
You can also practice trading to get familiarized with the platform before deciding to open a live account. By doing so, you’ll learn of the tips and features to help improve your trading efficiency.
#4 Product Range

There are so many instruments that can be traded – bonds, cryptocurrencies, commodities, indices, stocks, and more!
Have a glance at the products sheet to know if you are able to trade your favorite stock, index or cryptocurrency. You can find almost any bond, stock, exchange traded fund (ETF), and index CFD on Interactive Brokers’ trading platform.
How is cryptocurrency different?
How can you invest in cryptocurrencies safely?
What are the different categories of cryptocurrency?
Be equipped with the information you MUST know by clicking here.
#5 Bid/Ask Spread
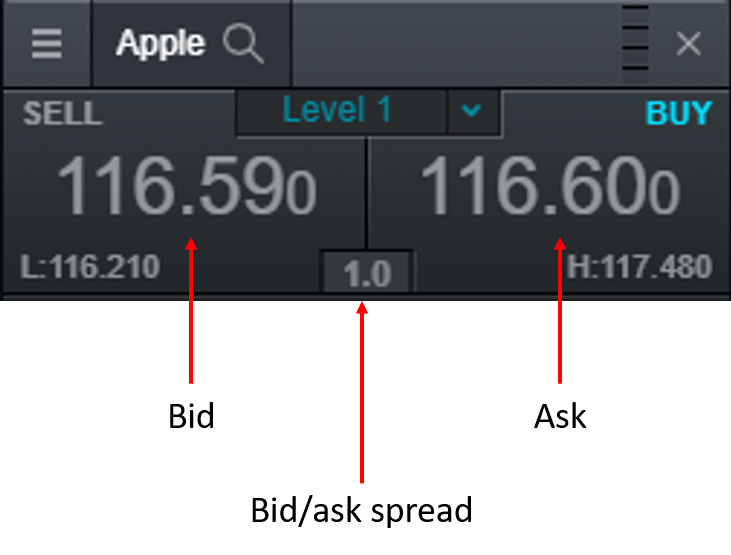
The tighter the bid/ask spread, the better. A bid/ask spread of 1 to 3 is acceptable for stocks below $50. A bid/ask spread of 1 to 6 is acceptable for stocks between $50 and $100. A bid/ask spread of 1 to 10 is acceptable for stocks above $100.
A tight bid/ask spread means that you don’t overpay for a stock when you go Long; and you don’t undersell your stock when go you Short.
The width of the bid/ask spread depends on several factors:
i) Liquidity
ii) News
iii) Broker
#6 Guaranteed Stop Loss
A guaranteed stop loss ensures that you close your position at the price you had determined regardless of gaps. This is especially important for stocks that are volatile which you’ll discover why below.
In the chart below, the gaps in the chart of TWTR are highlighted.
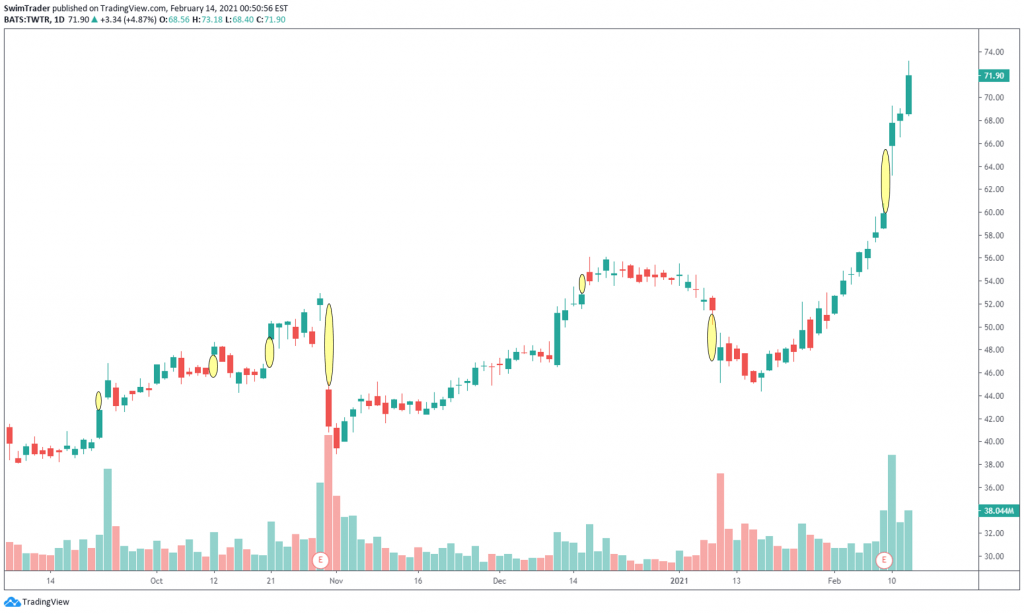
Here’s how the guaranteed stop loss works.
When you are Long and prices gap down (for any reason), the opening price may have shot below your regular stop loss level. Your regular stop loss order will therefore be triggered way below your intended price, causing you to lose more than planned.
When you are Short and prices gap up, the opening price may have pierced through your regular stop loss level. This would result in steep losses.
A guaranteed stop loss will ensure that you don’t get out at a worse price level. You will be sure that you are able to exit your trade at the price you’ve determined.
Imagine you had bought shares of TWTR in early Jan 2021. The share price of TWTR continued to drop. In fact, it dropped by 8.7% (from $51.48 to $47.09) at the gap down (shown by the yellow oval) in just 1 day!
By having a guaranteed stop loss at $50, you’d close your trade at $50.
If you used a regular stop loss at $50, your stop loss will not get triggered at $50. It will get triggered at the opening price of $47.09 instead. That’s almost $3 more in losses per share.
If a guaranteed stop loss is so good, there must be a cost. Yes, there is a tiny cost for this guaranteed protection.
This is a pretty new feature which CMC Markets and IG Markets provide.
Note: A guaranteed stop loss is known as a knock-out in IG Markets.
This isn’t a sponsored post. I just know 2 dependable friends in CMC Markets and IG Markets. Check out CMC Markets here, and IG Markets here.
#7 Minimum Deposit & Fees

Pay close attention to the fine print for obvious reasons.
While most brokers don’t require clients to pay for live market data, Interactive Brokers charges for live market data.
In addition, Interactive Brokers charges clients an inactivity fee of USD10+ while Saxo Markets charges clients a hefty USD100. Again, it pays to read the fine print as you don’t want to be hit with unnecessary fees.
#8 Customer Service & Technical Support
Have you had a sour experience where your issue wasn’t understood? Or a time where you had to wait for a long time before hearing back?
And if the trading platform of your broker is complex, you’ll want as much help as you can. This is another reason why you should sign up for a demo account first (see Point 3).
#9 Trading Platform
If this is your first time trading, you’ll want your trading platform to be as intuitive as possible.
The answers to “Which tool should I select to draw trendlines?”, “Where do I click to add the volume indicator?” ought to be figured out by yourself in a matter of seconds.
CMC Markets, IG Markets, Saxo Markets, and Tiger Brokers provide trading platforms that are easy to use. They are great for beginners and seasoned traders alike.
Phillip Securities provides a great trading platform, but it takes some time to learn how to use their functions.
TD Ameritrade provides a world class trading platform, but there is a steep learning curve. They have videos to help you navigate their platform, learning all the tips and features.
#10 Withdrawal
Easy withdrawal of your money is a must. You shouldn’t have to wait for a week or more.
#11 Suitability
Considering all factors, you’ll want to trade with either Phillip Securities, CMC Markets, IG Markets, Saxo Markets, or Tiger Brokers if you trade less frequently (about once a fortnight or less).
Interactive Brokers is more well-suited for the experienced and hyperactive brokers. This is because there is an inactivity fee involved if you don’t chalk up USD10 or more on commissions every month.
TD Ameritrade suits the more experienced trader. You’ll be able to trade Options (which is a more complex instrument).
Opening an account has never been easier. I recommend opening an account with Phillip Securities, CMC Markets or IG Markets as they offer a wide range of instruments and their trading platforms are intuitive. In addition, I know that you’ll be in good hands as I know the relationship managers personally.
This is not a sponsored post. I don’t get remunerated.
Cheat Sheet (Accurate as of May 2021)
I know that you are busy, so I’ve done up this cheat sheet. I hope that you find it handy.

1 Minimum deposit of $0 is only for bank transfers and checks. The minimum deposit amount for card is S$450.
2 Saxo Markets market data fee is waived if clients trade a minimum of 4 times across stocks, ETFs, or CFDs on the exchange each calendar month. The minimum is 6 for those listed on the Australian Securities Exchange.
3 Saxo Markets doesn’t charge a custody fee for Singapore residents. A custody fee of 0.25% applies for residents of other countries.
4 Interactive Brokers monthly inactivity fee is $0 for the 1st 3 calendar months. This monthly inactivity fee is waived if your monthly commissions is USD10 or more for accounts larger than USD2,000, and USD20 for accounts smaller than USD2,000.
How Much Money Do You Need To Swing Trade?
Now that you know which broker is suitable for you, you need to know how much money you need to start swing trading. Let’s explore the 4 factors which affects the amount of money you need.
#1 Stop Loss Amount
We are humans. Humans are emotional beings and we do fail. We don’t have nerves of steel and the discipline to sell a failing stock that we own. This is where a pre-determined stop loss level comes to the rescue.
I bet that you are thinking “Where should I place your stop loss level at? How do I determine a good place to put my stop loss level at?”
There is a highly reliable indicator which you can use – the Average True Range (ATR) indicator. Besides helping you to cut your losses fast, this indicator also helps you to prevent getting out of your trades prematurely. This means giving your trade time to work out before killing it.
The best part? The ATR indicator is free and available on most charting platforms.
Using the default settings of the ATR indicator, the ATR reading can be found at the right side.
 In this instance, the ATR reading is 0.45.
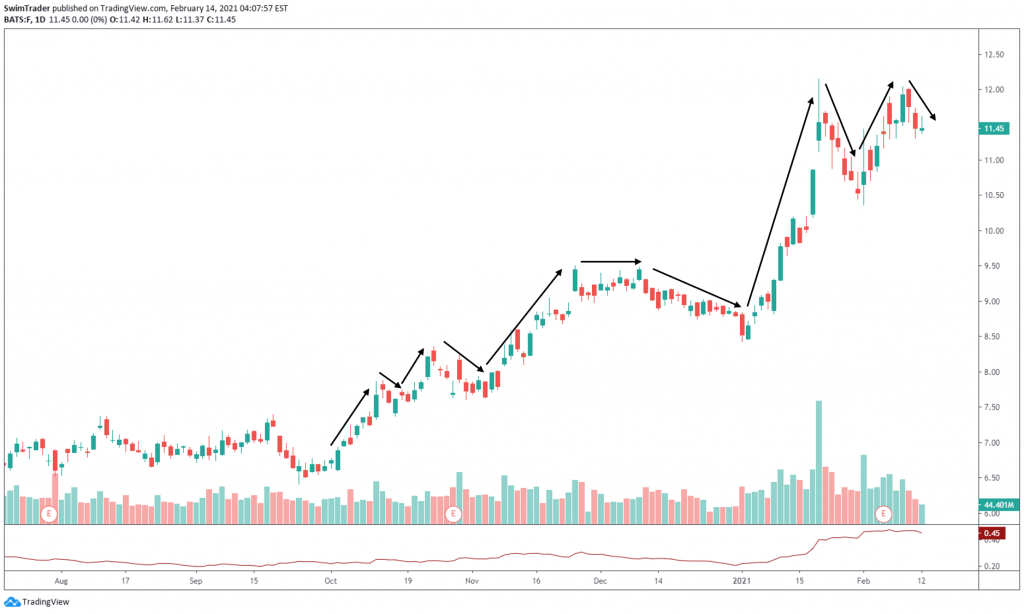
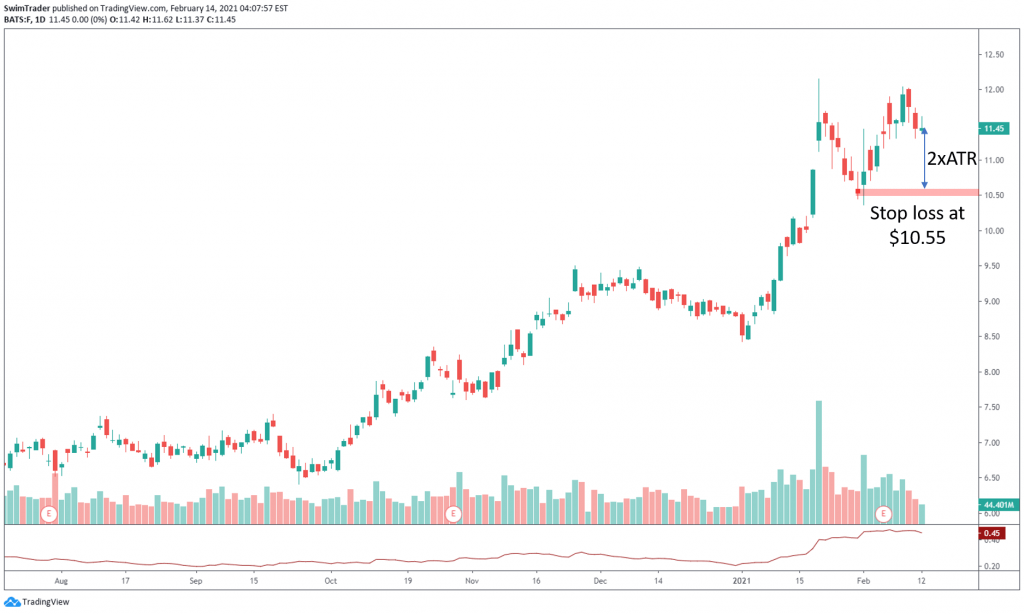
The chart of F has been exhibiting nice swing points lately. Let’s say you’d like to buy shares of F and your entry price is $11.45, where would your stop loss level be at?
Following the 2x ATR rule, you place your stop loss level 2x the present ATR (2 x 0.45 = 0.9). Your stop loss amount is $0.90. Your stop loss level will be at $10.55 ($11.45 – $0.90) as shown by the red box in the chart below.
I’ll use F as a case study throughout the sub-sections below.
#2 Position Sizing
Position sizing is a formula to help you know how many units you should be buying of any instrument (ie. stocks, currencies, indices, commodities, ETFs, and more). We shall focus on stocks.

Where,
Position Sizing is the number of shares you can afford to go Long or Short with the level of risk you can stomach;
% Risk is the percentage of risk you are willing to take for this particular trade;
Allocated Trading Capital is the amount of money you want to allocate to this trade;
Stop Loss Amount is the dollar amount per share that you are willing to lose.
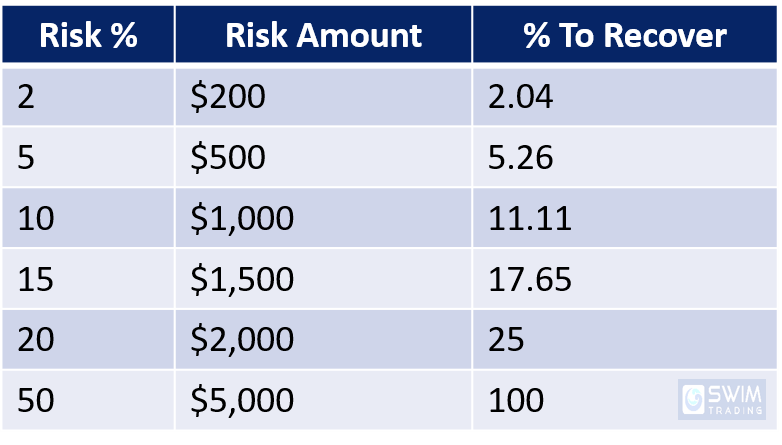
You are thinking if there is an optimal percentage of risk for trading. Though this depends on your risk appetite, I strongly encourage you to keep it at 2% or less. This is because the more you lose, the higher in percentage terms you’ll need to recover from your initial trading account size.
Imagine risking 10% and losing $1,000 on your $10,000 trading account. You’ll need to make 11.11% to get back to even.
Worse still if you risk and lose 50% (or $5,000). You’ll need to make 100% as shown in the table below.
You can allocate different amount of your trading capital money for your various trades. The allocation of trading capital is also known as Allocated Trading Capital.
Say you have a $10,000. You may wish to allocate only $5,000 for F. That’s fine.
Taking a 2% risk and knowing that your stop loss amount is $0.90, what is your position size (aka number of shares that you should buy) for F?
The answer is 555.
You don’t have to do the math. You can simply use one of our free tools to help you calculate this – our Position Sizing Calculator. Simply key in the numbers and viola! You know how many shares to buy!
#3 Leverage
Some brokers provide leverage. Leverage is a double edged sword. You can profit more than others quickly, and lose more than your initial trading capital quickly. Does this mean that you should totally stay away from leverage? The short answer is No.
There is a cheat sheet which compares 6 popular brokers for US stock trading in Singapore in the section titled Which Broker Should You Use.
Most indices, stocks, and ETFs can be leveraged by 5 to 20x. This means that you’ll just need to pay anywhere between 1/20 to 1/5 of the total amount for indices, stocks, and ETFs. Eg. you buy a 100 shares of a $100 stock. Without leverage, you’ll need to pay the full amount of $10,000.
With a leverage of 10x, you’ll just need to pay $1,000 to own the same number of shares.
For brokers which provide leverage, how can you utilize less leverage in your trades? Here’s how:
Since the level of leverage is 10x for most shares, I will use 10x to be the default leverage level for stocks.
As we wish to trade for many years, it is important to trade conservatively. Using half of the leverage given to you is one way to trade conservatively. Instead of keying in “10” into the leverage section of the Position Sizing calculator, key in “5”.
In this example, I have keyed in $5,000 as my Account Balance.
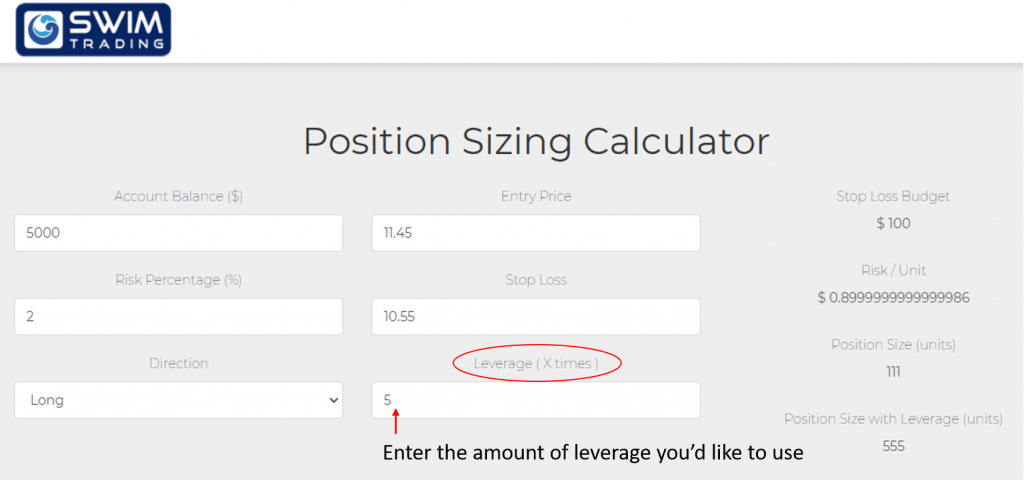
And you’ll instantly get your result on the number of shares you should buy. See the image below.
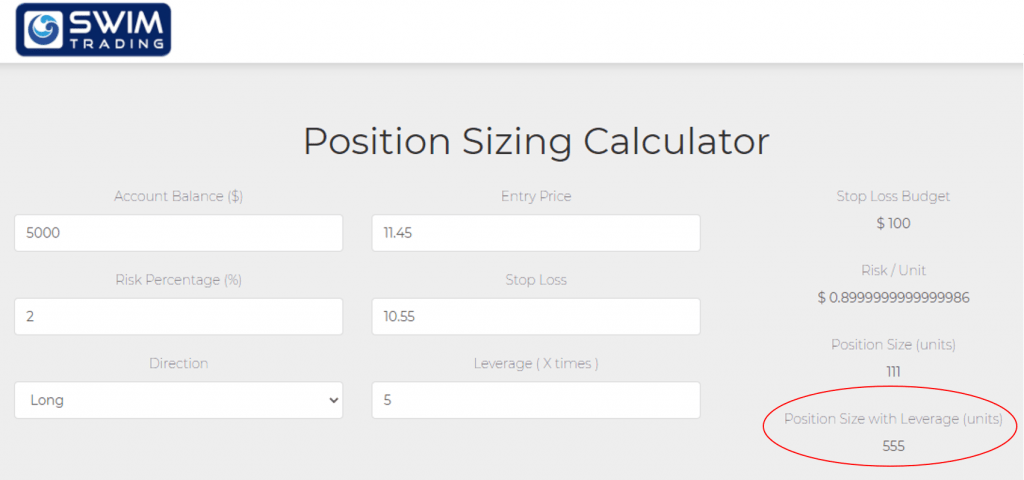
You can buy 555 shares of F!
#4 Price Of Stock
If you allocated $5,000 to swing trading shares of F, you can buy 555 shares. What about if you choose to swing trade the shares of GOOGL?
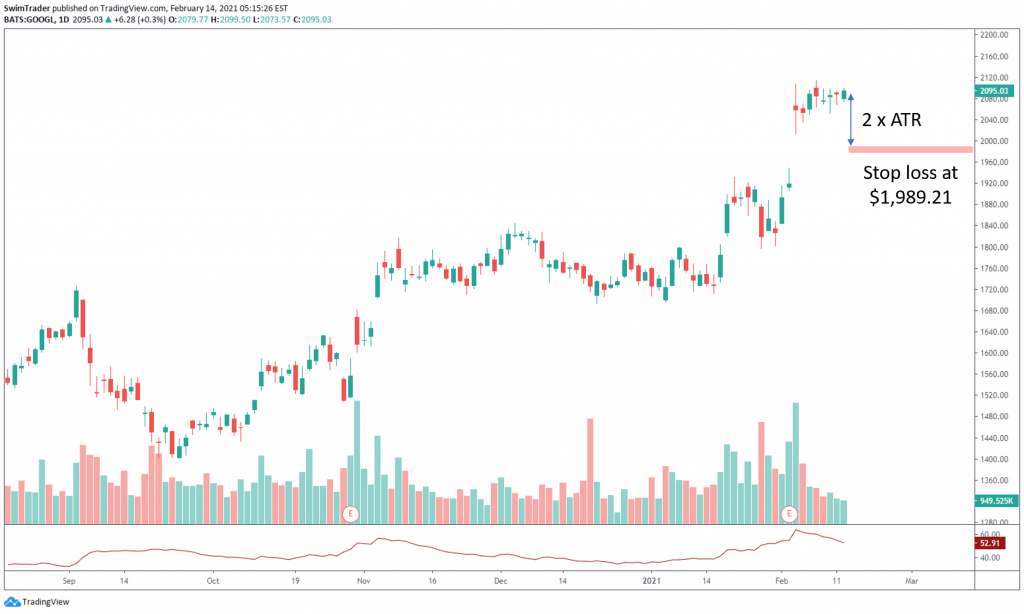
1st, you’ll need to calculate the stop loss level, which is 2x ATR. That’s $105.82 per share. This means that your stop loss level will be at $1,989.21.
Allocating $5,000 with a risk of 2%, and a 5x leverage, you cannot afford to buy any shares of GOOGL.
If you allocate your full trading capital of $10,000 with a risk of 2%, and a 5x leverage, you can buy 5 shares of GOOGL.
What does this tell you?
For a high priced stock, you’ll need more trading capital.
With a $10,000 account, you should be looking for stocks that are priced below $200. There are many stocks good and strong stocks which costs below $200 such as SNAP and MMM.
What’s A Good Charting Platform?
Knowing how much you need to get started in swing trading, you’ll now need to know which charting platform to do your homework on.
A good charting platform must be have these 5 important features.
#1 Easy To Use
Time is precious. You won’t want to spend a large amount of time learning how to use a complicated or complex charting platform.
The charting platform you use should be clean, intuitive, and fast.
#2 Cloud Based
A cloud based charting platform is a huge advantage.
A cloud based charting platform means that you can view your charts and analysis across multiple devices as long as you are connected to the Internet. Your charts and analysis will sync across your devices for convenience.
I was out one weeknight to run errands when a good friend of mine (who’s also a trader) sent me a text notifying me of a sudden drop in the US stock market. As the charting platform I was (and am still) using is cloud based, I could tell from my analysis if I should continue holding onto my trades or dump them immediately.
Better still, if my laptop were to crash, I won’t lose my plotting and research.
And when international travel resumes, you don’t have to bring your laptop with you as you can refer to the charts on your phone. This will reduce the weight of your luggage.
#3 Extensive Database

What should your charting platform have in its database?
a) Stocks
b) Indices
c) Exchange traded funds (ETFs)
d) Commodities
e) Currencies
f) Indicators
Indicators are useful in spotting strength and weakness of the instrument you wish to trade (stocks, ETFs, indices, commodities, and currencies). Indicators such as MACD, Volume, and RSI can notify you of an impending change in trend via divergence.
Which indicators are helpful? Which should you use and how do you use them? In Indicator Secrets, you’ll learn about 10 helpful and easy to use indicators. These indicators must be available in the charting platform you use.
Learn how these 10 indicators are formulated and how you can use them to powerful effect by clicking here.
#4 Customization
Customization includes color, thickness of lines, and the ability to annotate.
You’ll want to be able to customize your drawings so that you know what you know what you can better spot trading opportunities.
For example, my long-term trendlines are in dotted blue while my short-term trendlines are in dotted pink. My long-term support and resistance zones are in bold while my short-term support and resistance zones are in grey boxes.
 Your charting platform should allow you to customize the duration of indicators too. Eg. The default period for a simple moving average (SMA) is 20. You should be able to change it to 30 or even 50, depending on your trade’s time horizon.
The same goes for the other indicators such as the Relative Strength Index (RSI) indicator and a whole lot more.
#5 Length Of Chart Data
Some charting platforms provide charting data that only goes back for a couple of years. To be successful at swing trading, you’ll want at least 5 years worth of charting data. Why?
You’ll want to know the characteristic of the stock you are going to swing trade on. Has this stock been volatile all these while? Where are the weekly resistance zones? Has this stock been trending or stuck in a range for years?
#6 Screener

Ok, I know I mentioned that there are 5 important features of a good charting platform. This is a bonus feature.
If the charting platform you use has a screener, you’ll be able to unearth potential winning stocks, saving you a lot of time.
What should you be filtering for? How do you do that?
The answers will be revealed in the next section titled “Fundamental Analysis For Swing Trading“.
Fundamental Analysis For Swing Trading
The analysis I do for my trades is based on fundamental and technical. Fundamental analysis forms about 30% while technical analysis forms about 70%. This is because the fundamentals of a company don’t change as quickly as market sentiment (which is part of technical analysis). But this doesn’t mean that you should ignore doing your fundamental analysis for swing trading.
What are the key data that you want to pay attention to?
#1 Market Capitalization (market cap)
The episode of GME facing a short squeeze has highlighted the problem of being a small market cap company. GME’s market cap stood at approximately $1.3b in Dec 2020.
When a company has a small market cap, it can be manipulated easily. Being a shareholder of such stocks is akin to buying a time bomb.
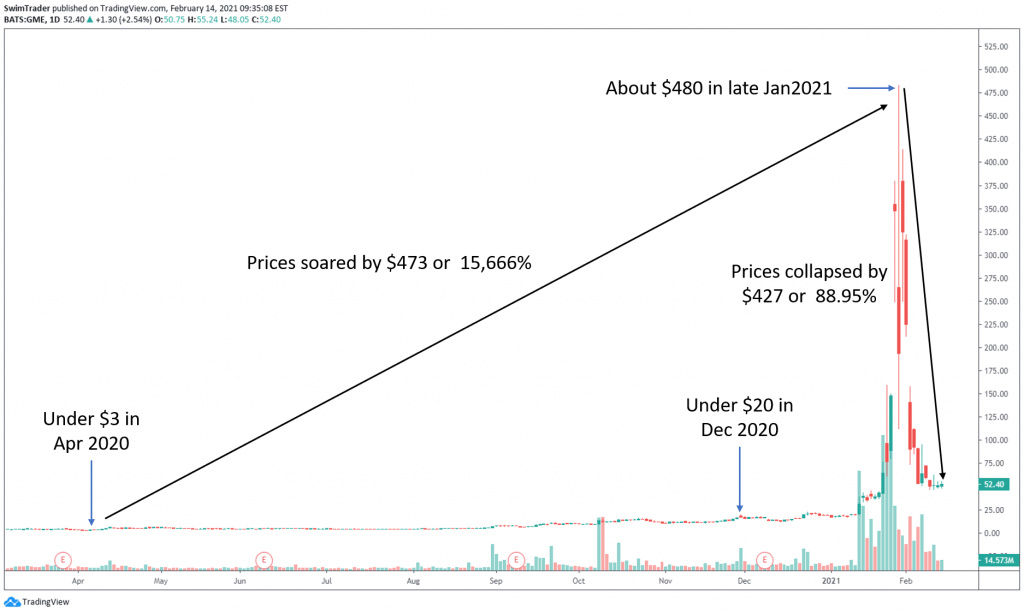
Since money is hard-earned. I don’t advise you to swing trade stocks which belong in the small or medium market cap category. Aim for companies that have a market cap of at least $10b.
#2 Debt To Equity Ratio

From the debt to equity formula above, you’ll want the debt to equity ratio should be as low as possible.
No sound company would take on huge amount of debts or have little equity.
#3 Earnings Per Share (EPS)

Because you want a high EPS score, you’ll want the total number of shares to be high, and the earnings of the company to be even higher.
A high EPS score means that the company is highly profitable.
#4 Sales Growth
Sales or revenue is the gross amount of income before the deduction of business costs.
Hence, if a company has been growing its revenue consistently over the past 5 years, it is growing stronger.
As mentioned earlier that the fundamentals of any business don’t change that quickly, and that the duration of a swing trade last for days to a couple of weeks, there is no need to dig too deep into a company’s fundamentals. You’ll want to put in more time into technical analysis instead.
Technical Analysis And The Tools You’ll Need For Swing Trading
You may recall that I rely mainly on technical analysis for my trades. You’ll soon learn of the reasons in this section and the subsequent ones.
What is technical analysis? Technical analysis is the study of price trends of any instrument. This means that technical analysis can be applied to cryptocurrencies, currencies, ETFs, indices, stocks, and more.
Technicians (the practitioners of technical analysis) believe that all available information has been factored into the price of any instrument. What better way to display prices than using charts? Therefore, technicians pay a lot of attention to charts such as the one below.
What can you tell from charts?
#1 Direction Of Prices
#2 Demand & Supply
#3 Key Levels & Turning Points
#4 Market Sentiment
#5 Volatility
Here’s an elaboration.
#1 Direction Of Prices
Charts are visual. At one glance, you’ll be able to tell if the price of an instrument is trending higher, lower, or stuck within a fixed range.
The trend of some stocks can be tricky to tell, so feel free to add in an indicator to assist you.
Tool You’ll Need
The most common and simplest indicator is the Moving Average (MA). Here’s how a MA looks like on the chart of LYFT.
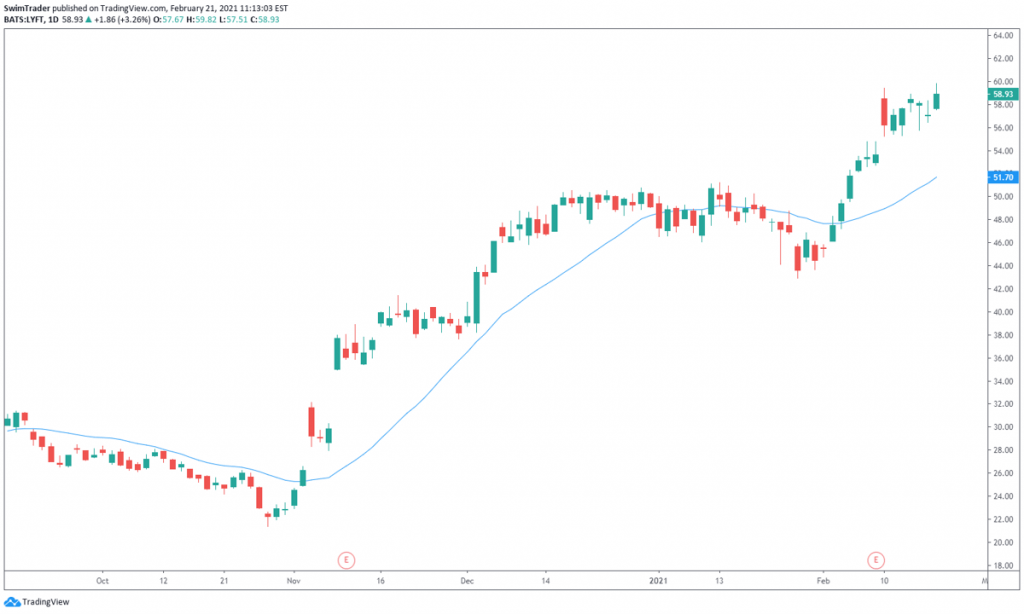
You can customize the time period of the MA. The most common time periods are 20, 50, and 200. Since swing trades usually last for days to weeks, a MA with the time period between 10 and 50 is ideal. I’ve used the 20 period MA for the chart above.
There are 2 main types of MAs too:
i) Simple Moving Average (SMA)
ii) Exponential Moving Average (EMA)
I won’t bore you with the different calculations here. You can read all about the calculations here.
The main difference is that the EMA is more responsive to changes in recent price movements than SMA is.
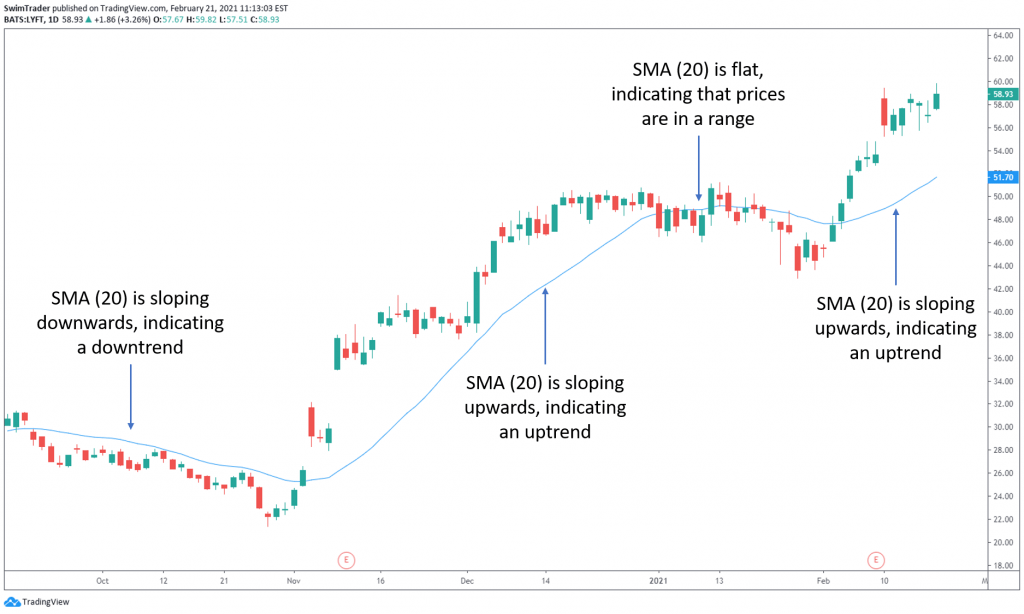
If the MA you have selected is sloping upwards, prices are heading up. If the MA is flat or moving up and down, prices are ranging. Confused, don’t worry. The chart of LYFT with a 20 period SMA (in blue) below will help you.
Let’s have a look at the same chart of LYFT, but with a 20 period EMA (in orange) instead.
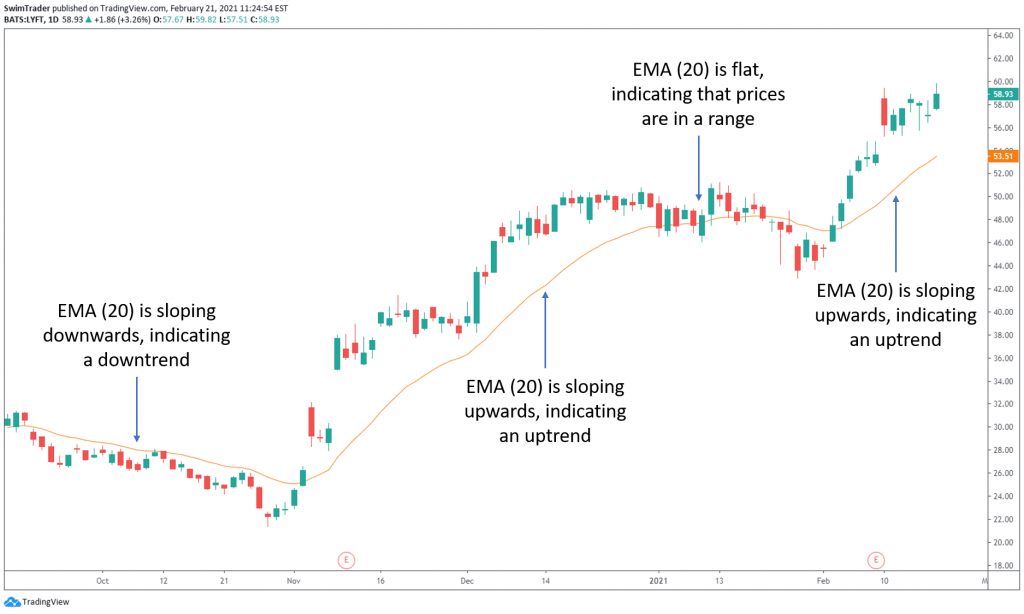
Can you tell that EMA is slightly more responsive that the SMA of the same period?
#2 Demand & Supply
There are a couple of easy ways to infer demand and supply of any instrument – volume, and support and resistance.
The best part? They are free!
Tools You’ll Need
i) Volume indicator
All good charting platforms have this indicator. There are several display settings which you can customize, of which I prefer “Columns”.
For stocks, each column of volume tells you the number of shares traded in that period of time. You’ll want to buy instruments which have high volume as this translates into high demand and supply.
Besides, instruments with high volume translates into liquidity. You’ll be able to sell your holding easily.
Now, look at the volume indicator which you have added to your chart again. What do you notice?
Did you notice that volume varies from day to day? There’re periods of high, low, increasing, and decreasing volume. Click here to learn of the 2 powerful applications of the volume indicator.
ii) Support & resistance
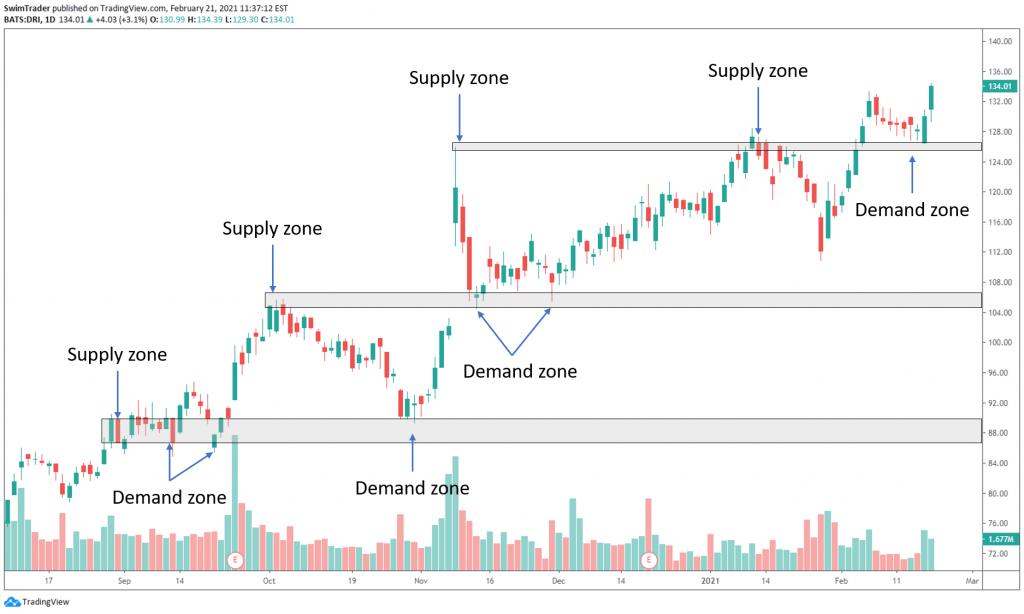
You may have heard of support and resistance. You may even have mapped out support and resistance zones on your charts. But hey, do you know why this is such an important free tool in technical analysis?
Support is an area where prices find a floor, unable to break below it. Resistance is an area where prices find a ceiling, unable to break above it. A picture paints a thousand words, so let’s take a look at the chart below to illustrate this.
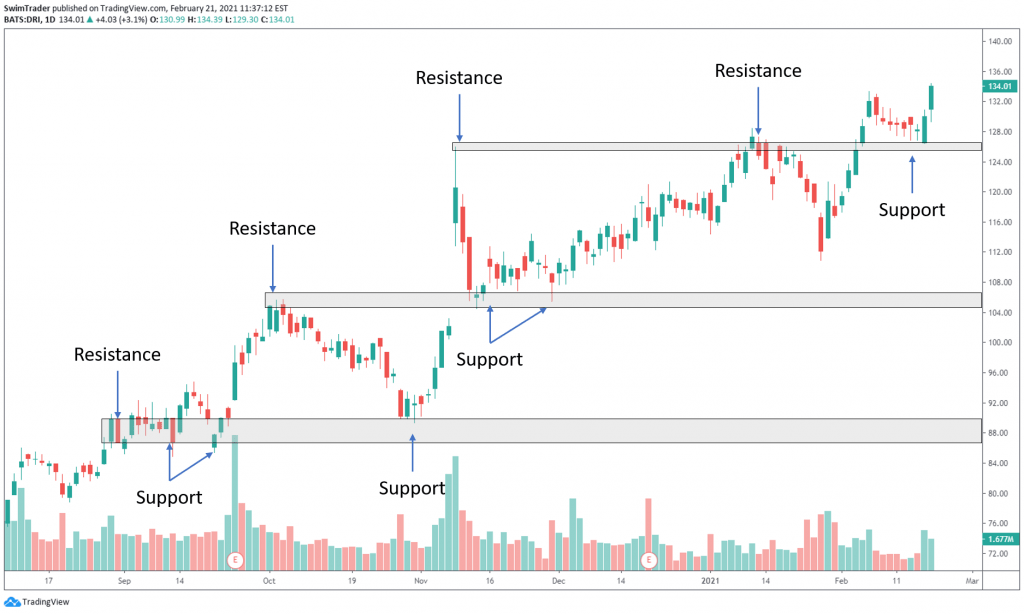
The reason why prices are unable to break below the support zone is because market participants find the price of that particular instrument to be cheap and acceptable. They’d purchase. As demand for the instrument at that price range intensifies, prices rise. What does this mean?
Support zones are demand zones.
The reason why prices are unable to break above the resistance zone is because market participants find the price of that particular instrument to be expensive. For those who had bought earlier, they are inclined to sell to realize their profit. As more market participants start selling, the supply increases. This causes prices to drop as selling intensifies. What does this mean?
Resistance zones are supply zones.
As the duration of a swing trade lasts for days to a couple of weeks, look at the past 3 years of charting data to plot your support and resistance zones.
You’ve learnt that support and resistance zones are zones of demand and supply respectively. The significance – prices tend to respect those levels and turn. This brings me to the next thing that technical analysis can shed light onto.
#3 Key Levels & Turning Points
There are several free tools to help you identify key levels and potential turning points on any chart.
You’ll want to know in advance where these key levels and turning points are to help you plan your trade and set the right expectation. Planning your trade includes shortlisting candidates to execute swing trading, calculation of the number of shares, contracts, units (for shares, commodities and currencies, ETFs and indices respectively).
Which tools do you need to spot key price levels and turning points in advance? How can you do this?
Tools You’ll Need
i) Support & resistance
The use of support and resistance has been covered in the previous section, so I’ll skip repeating myself here.
ii) Trendlines
Trendlines are sloping lines which you can easily plot on your charts.
As the duration of a swing trade lasts for days to a couple of weeks, you’ll just need to zoom out to start plotting your trendlines from the low of the latest crash (in Mar 2020) or the previous crash (in early 2019), whichever is lower.
How can you ensure that your trendlines are accurate and significant? Prices should touch your trendlines and bounce off at least 3 times.
Besides telling you of the potential turning points ahead, trendlines are able to tell you of the following too:
a) Diagonal support & resistance
Diagonal support and resistance? Remember the trait of an accurate and significant trendline? Prices should touch and bounce off your trendlines at least 3 times.
This is what support and resistance zones do too! Prices get stopped or bounce off their support and resistance zones.
b) Speed of ascent/descent

You can also the speed of the trend of any particular instrument by drawing trendlines. The speed of any trending instrument can be inferred from the gradient of your trendlines.
Interested in knowing more about trendlines? I’ve written an article on trendlines recently and you can read it here.
Practice makes perfect, so have a go at plotting trendlines!
If you are unsure whether the trendlines you have drawn are accurate, share your chart with us on our Facebook Group by clicking here and we will guide you. Share your findings on our Facebook Group too!
iii) Pivot Points
Pivot Points is a less known indicator. However, it is widely used by professional traders.
The Pivot Points indicator is based on a mathematical formula which can be found here.
The idea behind this indicator is to buy at the instrument’s pivot point and sell at its 1st resistance level (which is termed R1) in an uptrend. If the trend is strong and shows no sign of slowing down, buy it again at its 1st resistance level and sell it at its 2nd resistance level (termed R2).
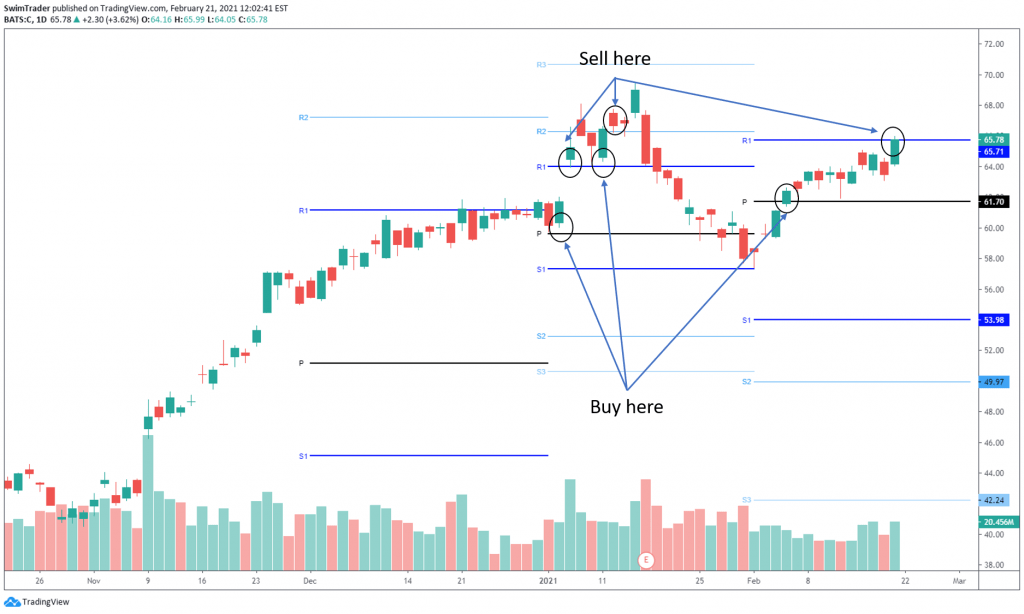
The Pivot Points indicator should be of a higher timeframe than the timeframe you use for your charts. If you trade based on the daily chart, you should be using the monthly timeframe for the Pivot Points indicator.
iv) Relative Strength Index (RSI)
The RSI indicator is a dynamic and powerful indicator (below the Volume indicator). It can warn you of an impeding turning point.
There are 2 main levels that the RSI indicator marks out – overbought (>70) and oversold (<30).
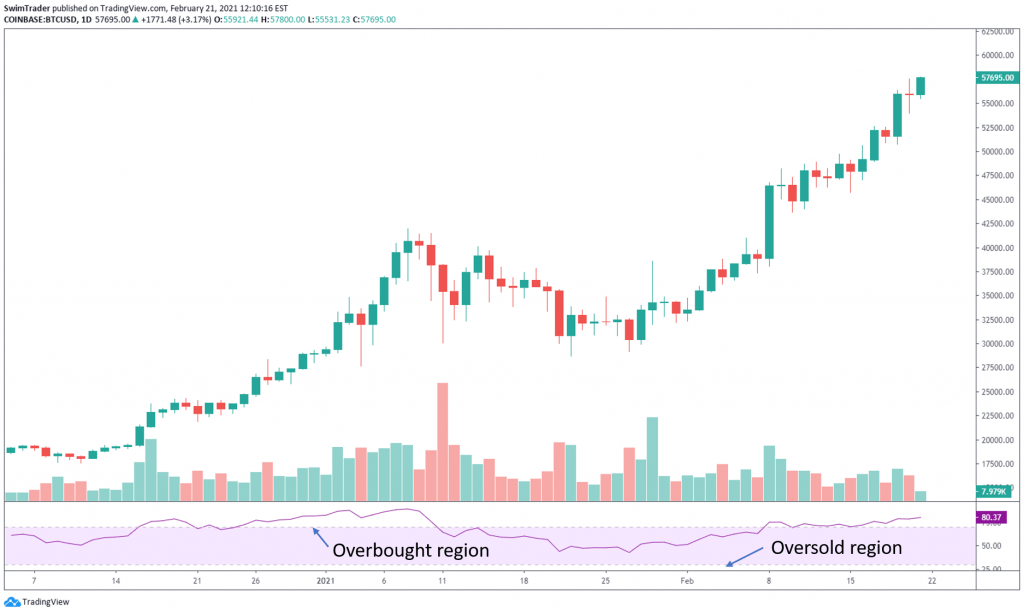
As the names of the 2 levels suggest, when the RSI reading is >70 (overbought), prices are highly inflated and should drop soon. When the RSI reading is <30 (oversold), prices have been sold to the bottom and should rise soon.
Hang on! Before you get too carried away and start buying stocks or other financial assets that are oversold (<30) or sell short those that are overbought (>70), please note that all financial assets can remain in the overbought or oversold region for some time before prices turn.
Predicting turning points is best done with a combination of 2 or more of these techniques mentioned above.
The RSI indicator is capable of much more than predicting turning points. To discover more applications of the RSI indicator, click here.
#4 Market Sentiment
Would you like to know if the market sentiment is bullish, bearish or meh? Reading the market sentiment will be helpful in timing your trades which reduces your exposure to market risks.
This can be done by using the 2 tools mentioned below.
Tools You’ll Need
i) Candlesticks
Why use candlesticks?
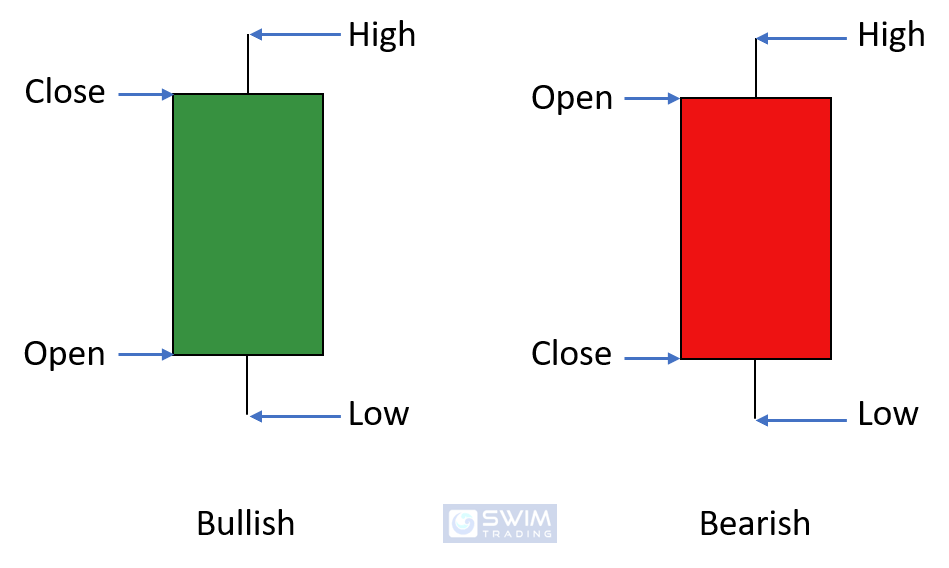
Candlesticks are rich in details which captures the market sentiment for that trading day and before. The use of candlesticks can also tell you the strength of the trend.
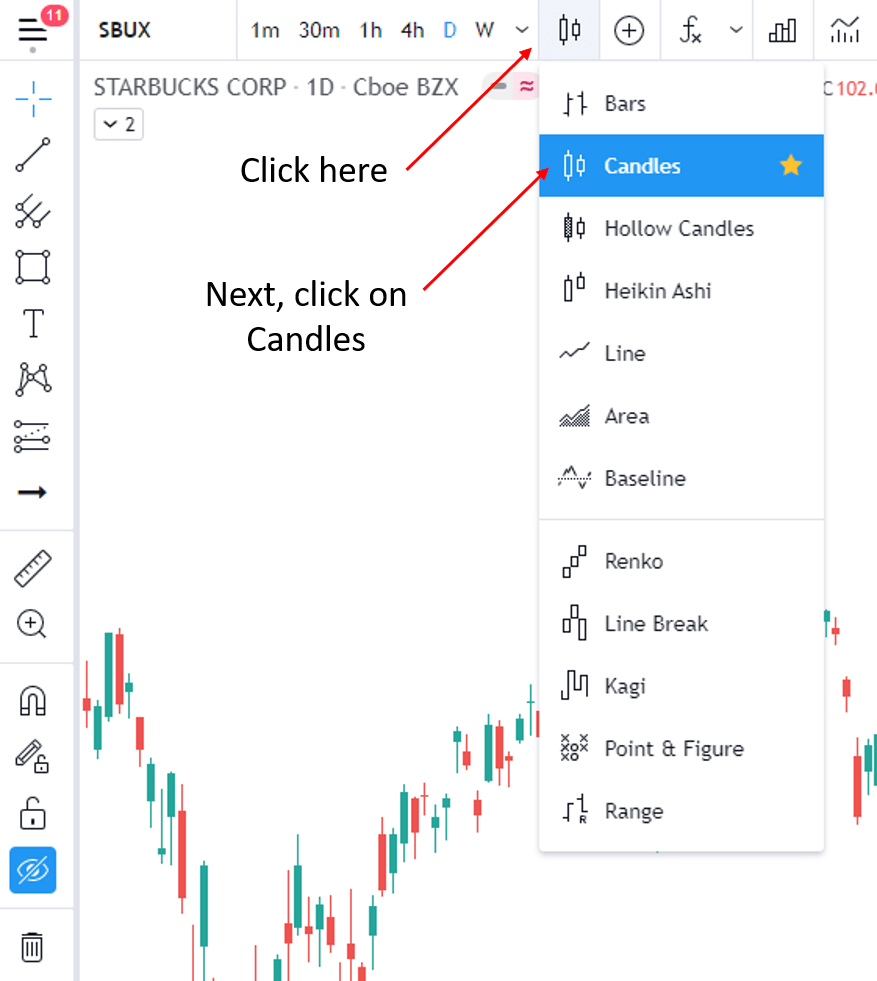
Before I share about how you can read the market sentiment using candlesticks, here’s how you can switch to viewing candlesticks on your chart.
If you are using Tradingview, you’ll see a bar at the top of your chart. Click on the icon that’s next to the timeframes and select “Candles”.
Now, did you notice that there are 2 colors of candlesticks – red and green? When a trading session closed higher than its opening price, the body and wicks of the candlestick are green.
When a trading session closed lower than its opening price, the body and wicks of the candlestick are red. Don’t you love how visual they are?
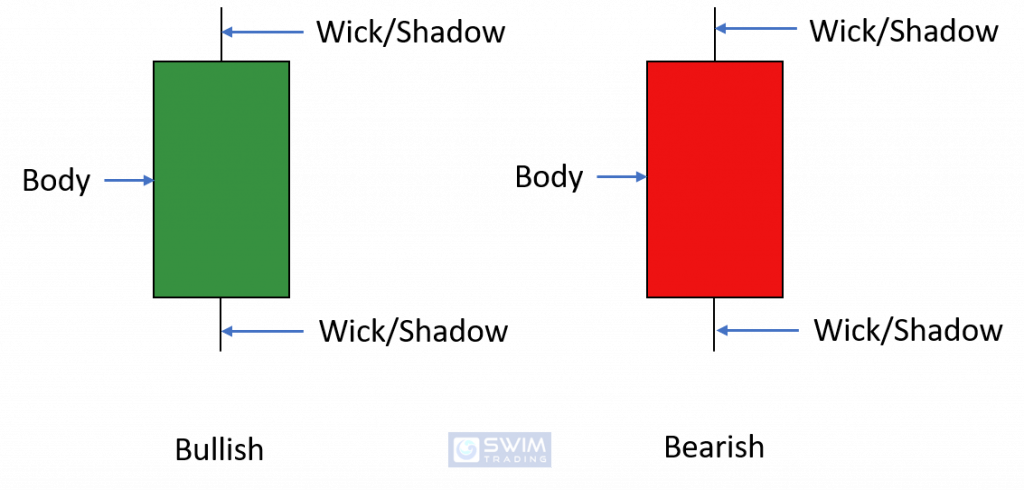
Did you also notice that the bodies of candlesticks differ? Some candlestick have green/red long bodies. Some have green/red short bodies. Some don’t seem to have a body at all. What’s the significance of the body length of candlesticks?
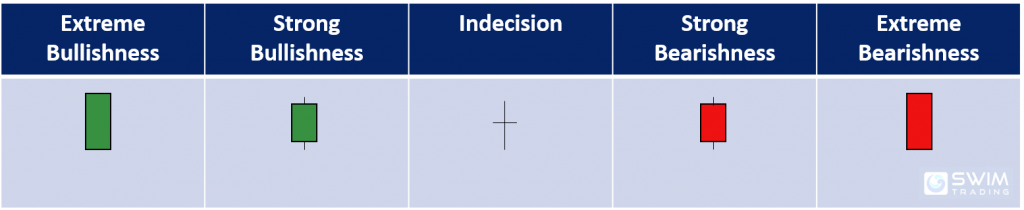
Ok, so the candlesticks that are in green are bullish and those in red are bearish. Those with a tiny body are indecision candlesticks where the market participants are either not interested or undecided. How does this apply to the real world of trading?
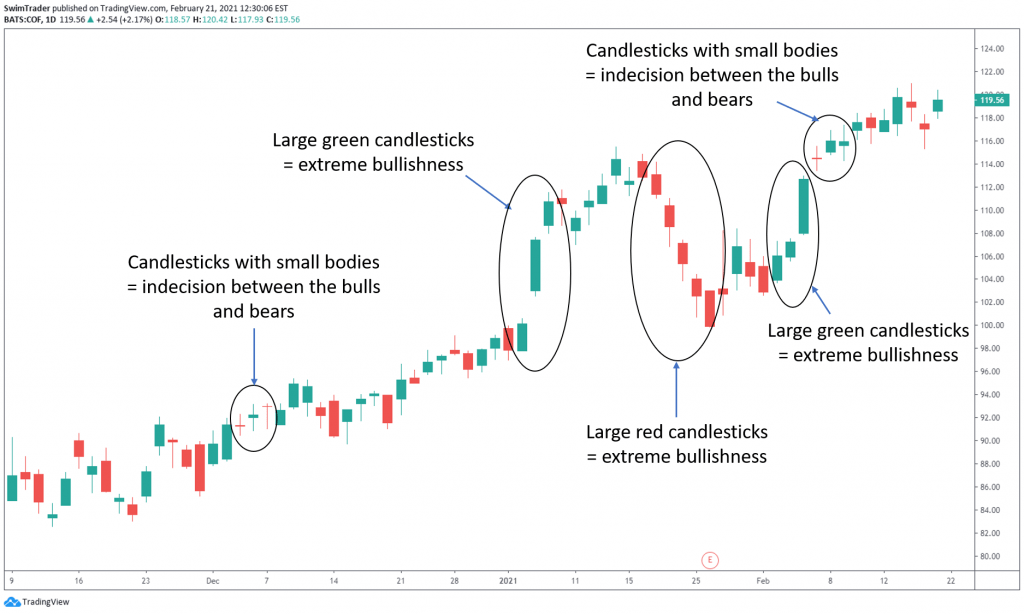
As you can see from the chart of COF above, there are small and huge candlesticks. When there are large green/red candlesticks, the move up/down is steep and swift.
When the green/red candlesticks are smaller, the move up/down is more gradual.
ii) Volume

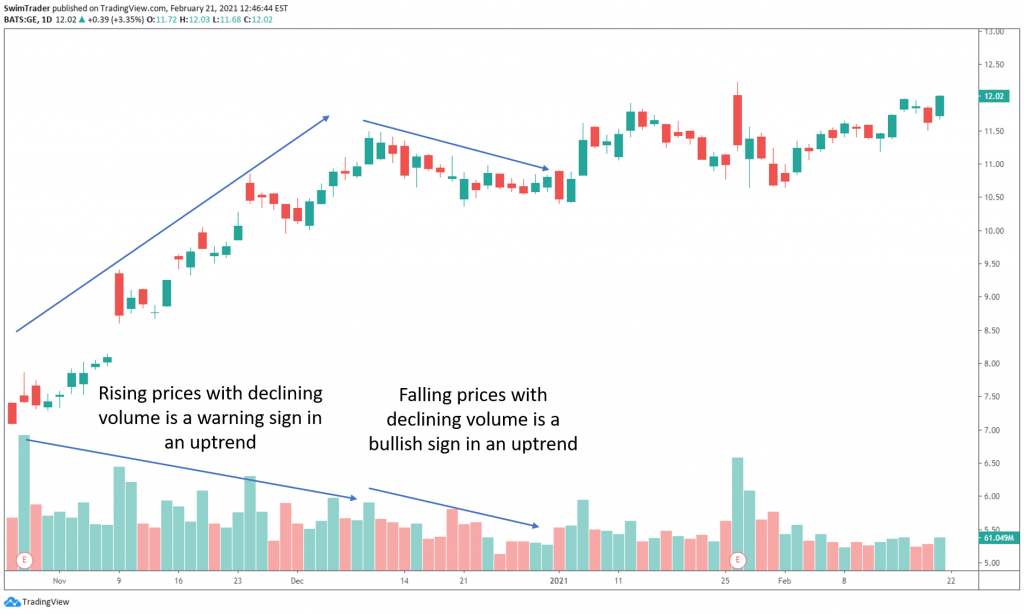
Can you recall that volume tells you the number of shares traded in that period of time? What does this mean in terms of market sentiment?
If there’s strong demand or supply, there’ll be high volume. This infers that the volume should be high when there is a trend (up and down). However, there’re moments where the price of an instrument is trending higher while the volume is low or descending. This is a red flag, signaling a change in market sentiment.
Why?
Imagine I come up with a new watch brand called Swim. It’s intricate, automatic, and made in Switzerland. It’s priced at $8,000. Will there be buyers? Maybe. It is highly likely that I’ll just have a few buyers.
One day, Drake was spotted wearing a Swim watch during an interview to promote his latest single. Other celebrities start wearing a Swim watch. All of a sudden, the world knows about Swim watches and wants it.
The price of a Swim watch rises tenfold to $88,000.
One year goes by and my watch isn’t worn by celebrities anymore. Can my watch still command $88,000? It is unlikely. Since demand and excitement have dropped, the price of a Swim watch should drop as well. It doesn’t make sense for it to hold its price tag of $88,000, especially for a new brand that’s up and against giants such as Rolex and Audemars Piguet.
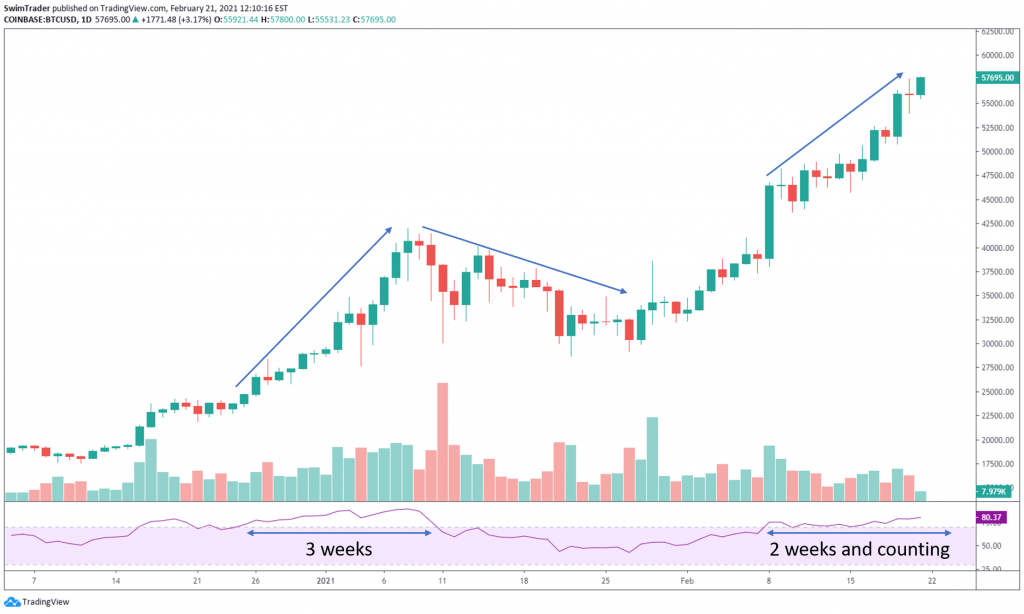
As prices continue to climb/slide, demand/supply should be high, hence volume should be high. If volume decreases while prices climb/slide, market participants are losing interest to buy/sell. A stall of the existing trend or even a trend reversal is near.
Let’s have a look.
#5 Volatility
Depending on your risk appetite, you may not want to trade an instrument that’s volatile. Volatility is necessary as this means that prices are moving for you to have a chance at making money.
Do you remember the formula for position sizing?
A volatile stock widens your stop loss amount per share. This equates to the ability of buying fewer shares than those that are less volatile.
Are there tools to help you spot an increase or decrease in volatility?
Tools You’ll Need
i) Average True Range (ATR)
ii) Bollinger Bands
iii) Donchian Channels
iV) Ketlner Channels
The Bollinger Bands, Donchian Channels, and Ketlner Channels indicators can tell if an instrument is volatile. Volatility can be seen from the width of the Bollinger Bands, Donchian Channels, and Ketlner Channels. The wider the bands or channels, the higher the volatility of an instrument.
I’ll not elaborate on the Bollinger Bands, Donchian Channels, and Ketlner Channels indicators here.
You can learn about the Bollinger Bands indicator by clicking here.
You can learn about the Donchian Channels by clicking here.
You can learn about the Ketlner Channels by clicking here.
2 Swing Trading Strategies & The Psychology Behind Them
You’ve finally reached the section on swing trading strategies! Give yourself a pat on the back!
In this section, you’ll learn of 2 common yet powerful swing trading strategies and the psychology behind them. What are the 2 swing trading strategies?
#1 Flag
#2 Pennant
#1 Flag
This chart pattern is the most common and can be found in most (if not, all) instruments. Please note that for the flag chart pattern to work brilliantly, prices of the instrument must already be trending.
The flag chart pattern consists of 2 parts – pole and flag, as noted on the charts below.
Here’s an example on the chart of S1! (Silver futures).
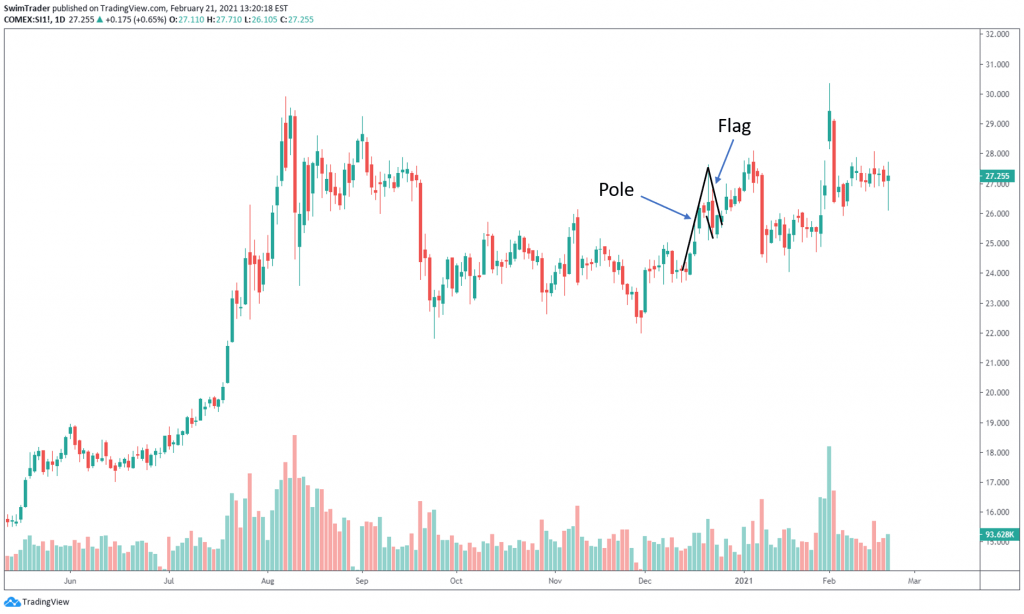
The pole is an upward/downward thrust (in an uptrend and downtrend respectively). A steep pole is preferred.
The flag is made up of 2 parallel lines which run horizontal or opposite to the direction of the pole.
Market Psychology
Volume must be high or increasing as the pole is being formed.
In an uptrend, market participants are super bullish. Demand is high as inferred from increasing or high volume. This results in a surge in prices. Therefore, there must be high or increasing volume as the pole is being formed.
Whatever that goes up must take a break or come down. Imagine sprinting 400m. Can you sprint another 400m immediately? Not unless you’re a seasoned runner.

This is the same with trading. Prices will need time to rest and recover before rising or surging again.
Therefore, there’ll be a short break from the rise. Prices will either stagnate or dip for a short while. As prices stall or decrease, there should be low or decreasing volume. Can you tell why?
When prices are decreasing with high or increasing volume, it means that the downtrend is likely to continue given that the supply is high. Falling prices with falling volume indicate that the selling is drying up, so the decline of prices is about to stop.
The direct opposite is true in a downtrend. Market participants are bearish. Supply is high and this can be inferred from low or decreasing volume. This causes a collapse in prices. Hence, there must be high or increasing volume as the pole is being formed.
After a while, there’ll be a short break from the decline in prices. Volume should be low or decreasing here as the sell off stalls.
Once the market participants are ready to enter the market again, demand/supply increases (in an uptrend and downtrend respectively), sending prices higher/lower. This is the moment you’ve been waiting for to buy/short-sell.
Swing Trading The Flag Pattern
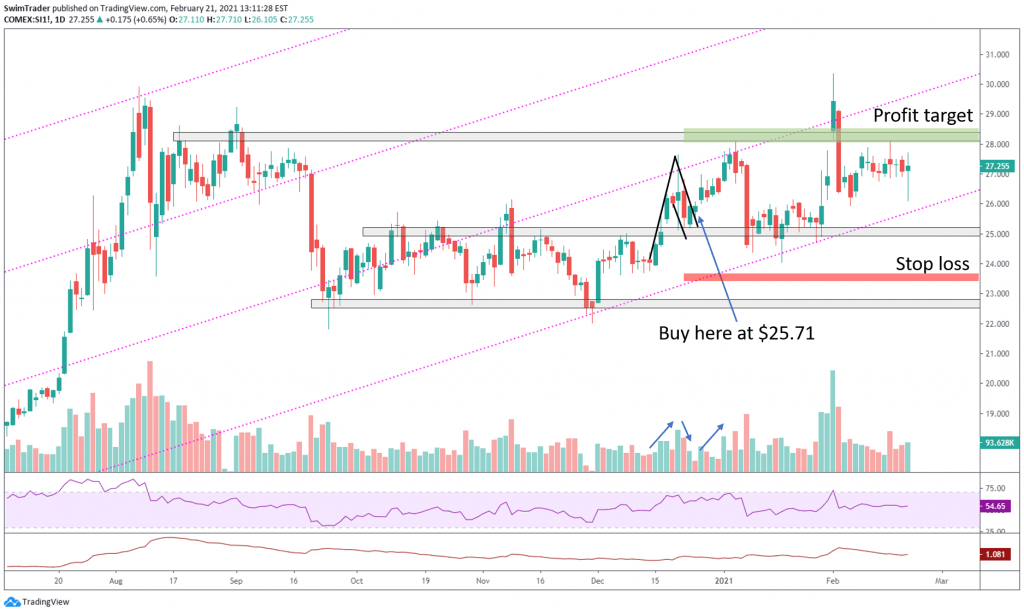
Silver is in an uptrend. A perfect flag chart pattern appeared in the middle of Dec 2020.
The pole was long and steep. Volume was increasing throughout the formation of the pole.
The flag ended at $25 which coincides with the support zone. Volume was also decreasing as the flag was formed.
Take a look at the ATR and multiply it by 2 to give you the stop loss amount per ounce of Silver. That’d be $1.96.
The entry would be at $25.71. To calculate where to place your stop loss at, subtract the stop loss amount from your entry price. That’d be $25.71 – $1.96 = $23.75.
Where should you place your profit target level at? It should be placed at the next resistance.
If these rules and steps are followed, you’d have made a tidy profit of $2.30 per ounce of Silver bought. That works out to 8.9% in 2 weeks!
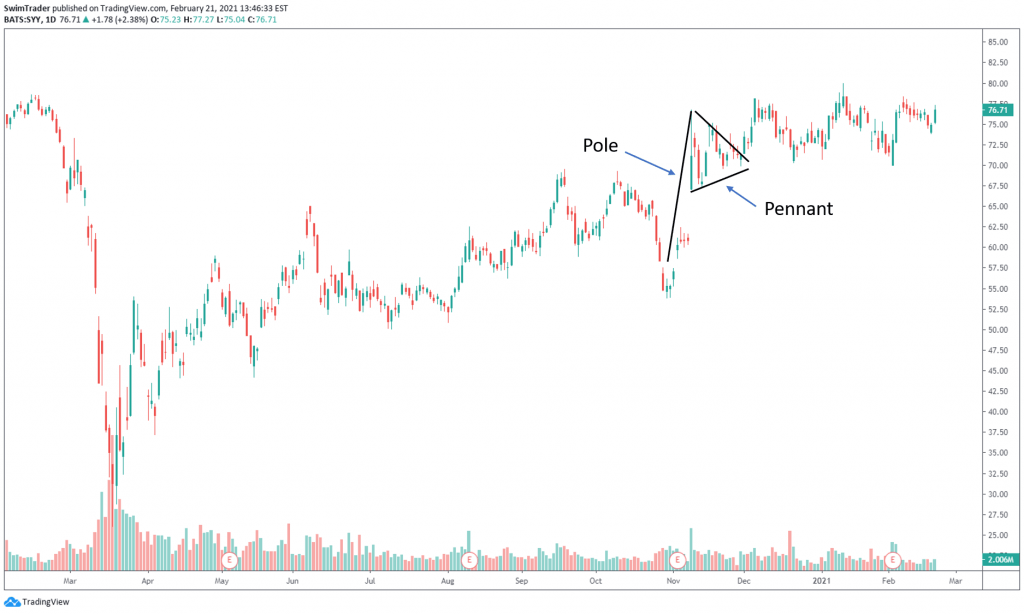
#2 Pennant
The pennant chart pattern is not as common, but the strategy and psychology behind it is the same as the flag chart pattern. Please note that for the pennant chart pattern to work according to plan, prices of the instrument must already be trending.
The pennant chart pattern is also made up of 2 parts – pole and pennant, as pointed out by the chart below.
Market Psychology
In a bullish market where prices are rising, you’ll want to see high or increasing volume on the up swings. You’ll want to see low or decreasing volume as prices pullback.
This is because the market sentiment is optimistic. Buyers are entering the market, driving up demand. There are more green and large candlesticks.
As we all know, all good things must come to an end, at least temporarily. Rising prices will have to take a break by ranging or declining a little. As prices stall or decrease, there should be low or decreasing volume.
The direct opposite is true in a bearish market. Sellers are in control, so there will be many red and large candlesticks. You’ll want to see high or increasing volume on the down swings to signal strong bearish momentum, and low or decreasing volume as prices pullback.
Swing Trading The Pennant Pattern
SYY is in an uptrend. A perfect pennant chart pattern appeared in Nov 2020.
The pole was long and very steep. Volume was increasing throughout the formation of the pole.
The pennant ended at $69 which coincides with the support zone. Volume was also decreasing as the flag was formed.
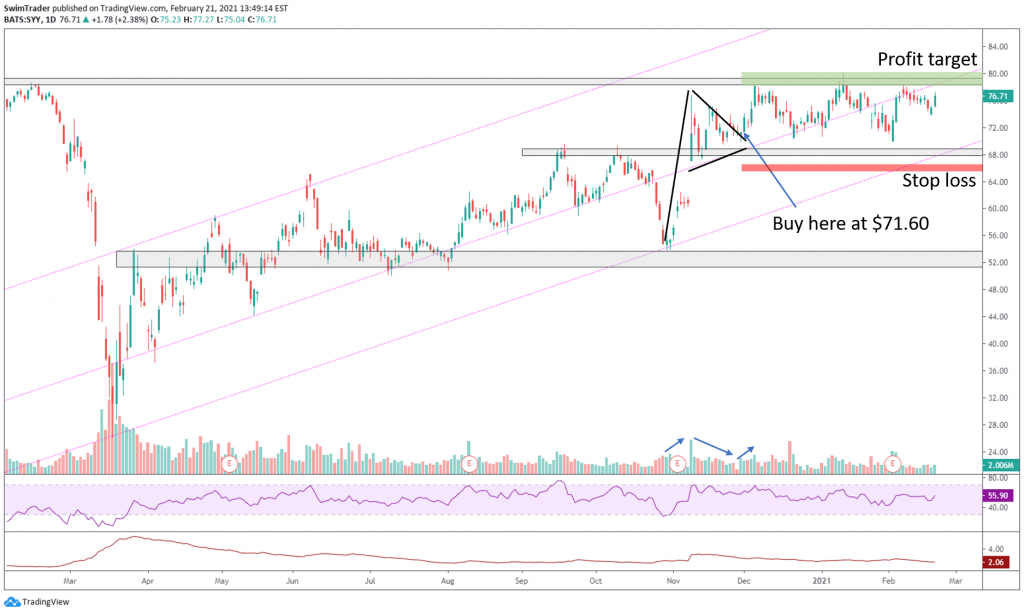
The ATR was $2.62 then. Multiply it by 2 to give you the stop loss amount per share of SYY. That’d be $5.24.
The entry would be at $71.30. To calculate where to place your stop loss at, subtract the stop loss amount from your entry price. That’d be $71.30 – $5.24 = $66.06.
Where should you place your profit target level at? It should be placed at the next resistance.
If these rules and steps are followed, you’d have made a tidy profit of $7.70 per share of SYY bought. That works out to 10.7% in just a week!
Combination Of Technical Analysis Drawings And Indicators

The above mentioned chart patterns appear all the time. For best results, pair them with trendlines, support and resistance, volume, RSI, and ATR indicators.
Why is this a good combination of indicators?
#1 Trendlines are diagonal support and resistance zones. They can also tell you the speed of ascent or descent, enabling you to maximize your money by picking the faster moving stock.
#2 Support and resistance are demand and supply zones. They tell you the areas where market participants are keen to buy or sell, causing prices to rise or fall.
#3 The Volume indicator tells you if the up or down move is legitimate. This helps you avoid being trapped in a fake move.
#4 The RSI indicator tells you if the instrument is in the overbought or oversold territory. This allows you to time your entries and exits better.
#5 The ATR indicator tells you if the volatility of the instrument and the price level to safely place your stop loss at.
Refer to the chart of Silver futures and SYY above as examples of combining technical analysis drawings and indicators to swing trading profitably.
The Mindset Of Successful Traders

Successful traders have gone through spells of losses. They have come to terms that having the right strategy doesn’t equate to winning all the time. There will still be spells of losses.
But they have mastered their trading mindset.
To master this mindset, you have to realize that the goal of trading (or swing trading for this matter) isn’t purely to make money.
The aim is to improve in taking your trades. Aim only for the good ones and let the rest go. Missed a good trade? It’s ok. Don’t chase it. Let it go.
The other aim is to become consistent in your decision making.
By working on your technique, strategies, and decision making, you’ll improve on your trading.
Successful traders plan well, are aware of one’s emotions (before, during, and after buying or short-selling), stick to their plan, and are disciplined in money management.
They spend time to analyze the market and forming a watchlist, plan how much to allocate to each instrument before applying position sizing, identify and choose the strategy they’d like to use, plotting their charts, checking their emotions to stay calm and focused, and lastly to stick to the main plan before considering if they need to activate their contingency plan if the trade doesn’t go as planned.
Doing all the above, they hardly feel stressed because of trading. They are able to experience life with their loved ones.
Practice these qualities of successful traders. Think of improving your focus, emotional calmness, strategies and techniques, and work on your decision making.
21 Things You Have Learnt

#1 We are retail traders who are insignificant in the stock market
#2 Swing trading is a trend following strategy
#3 A swing in an uptrend is an upward move while a swing in a downtrend is a downward move
#4 Swing trading is even suitable for complete beginners
#5 The holding period for swing trading is longer than day trading, but shorter than position trading
#6 The win rate for swing trading is much higher than the win rate for position trading and day trading
#7 Swing trading can be applied to instruments which have an established price history and trend
#8 11 important features a good broker must have (cheat sheet included)
#9 4 factors which determines the amount of trading capital you need
#10 How many shares you should buy with the trading capital you have
#11 6 essential features of a good charting platform
#12 Fundamental Analysis is important, but there’s no need to spend a lot of time on this
#13 4 data sets you’ll need to analyze a company’s fundamentals
#14 Technical analysis can tell you the direction of prices, demand and supply zones, key levels and turning points, the sentiment of market participants, and volatility
#15 How to tell if a trend is strong through the size of the candlestick
#16 There are many different technical analysis tools and indicators to help you
#17 The uses of the different technical analysis tools and indicators
#18 Spotting the 2 chart patterns correctly and entering at the right time
#19 Set your stop loss at least 2x ATR below/above your entry in an up/down trend
#20 Combine the different technical analysis tools and indicators to get the ideal result
#21 Successful traders always seek to improve on their strategies, techniques, and decision making
Here’s What You Can Do To Improve Your Trading Right Now:
#1 Register for our market outlook webinars by clicking here
#2 Join us in our Facebook Group as we can discuss the various ways of applying this by clicking here
#3 Never miss another market update; get it delivered to you via Telegram by clicking here
#4 Grab a front row seat and discover how you can expand your trading arsenal in our FREE courses (for a limited time only) by clicking here
See you around!
