
My family believes in independence. They believe that independence is the backbone to success in one’s life. So, I had to earn my own keep while studying in University.
While at my part-time job, I noticed that Paul (not his real name) would always pull out his phone and run off to a corner during breaks to use his laptop. One day, I peered over his shoulder and noticed that he was looking at charts of stocks. Being curious, I asked him about stock trading and entered the world of trading.
Initially, I used line charts. I switched to candlestick charts after discovering the power and advantages of it.
Before I start sharing about candlesticks, it is essential that you understand what swing trading is, open a trading account with a reputable and good broker, sufficiently fund your trading account, and select an excellent charting platform.
Done that? Let’s find out about candlesticks!
#1 What Are Candlesticks?
Candlestick charting is a type of charting which provides the Open, High, Low, Close of every trading session. Candlesticks are also colored for better visualization at one glance. Here’s an example:
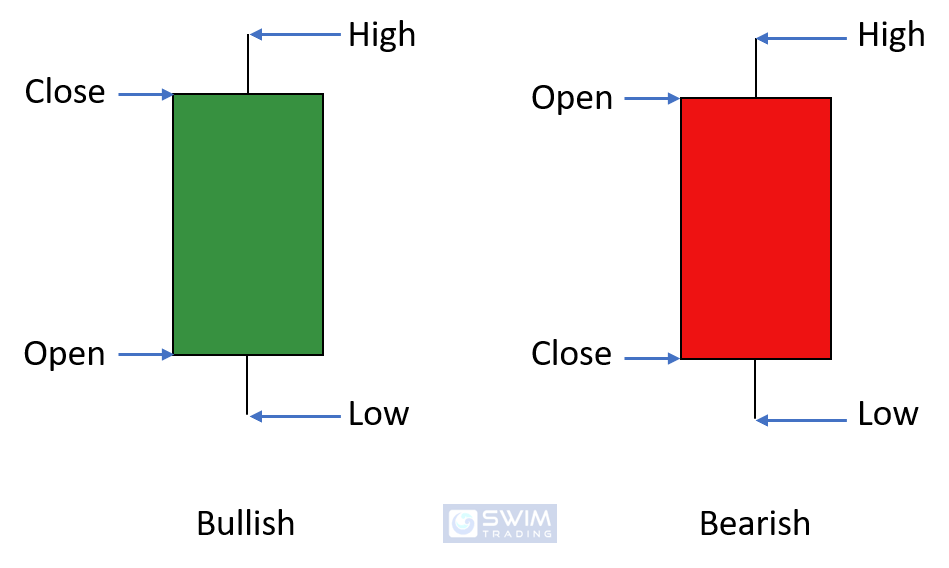
By default, a bullish candlestick will be green in color while a bearish candlestick will be red in color.
Please note that color is the opposite if you are using a Chinese charting platform. Check the settings to find out if you are able to change it to the default settings that we are all used to (where bullish candlesticks are in green and bearish candlesticks are in red).
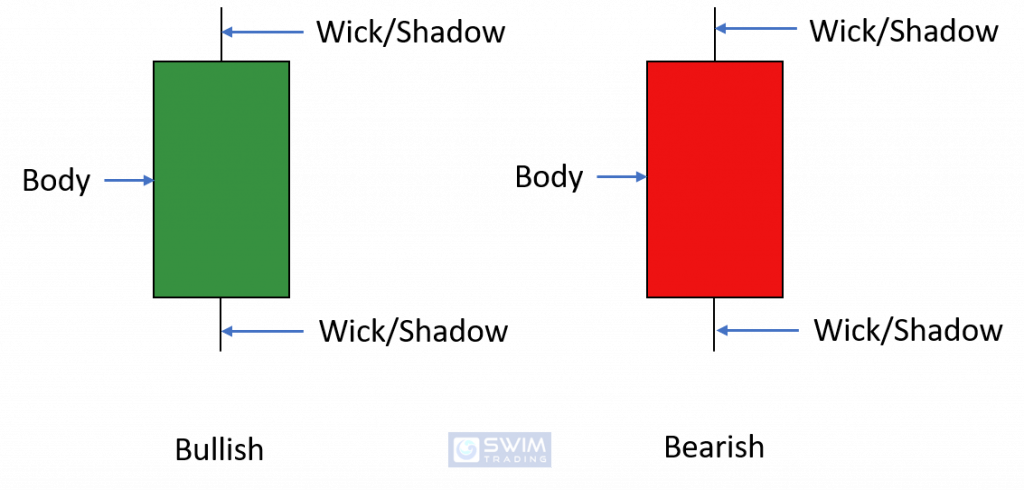
What are the parts that make up every candlestick?
I’ll share more about reading candlesticks in the sections to come.
Why did I switch from a line to candlestick chart?
#2 Candlesticks VS Line
Remember that I started off with line charts? I started off with line charts because they are the easiest to read at a glance. I could tell the trend immediately.
Here’s how a line chart of Z looks like:
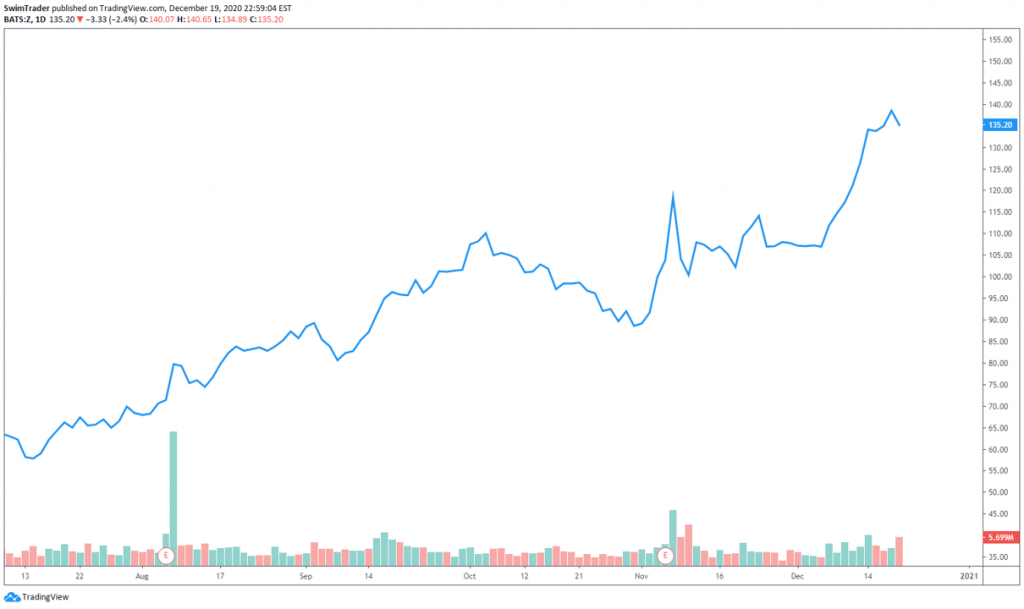
Here, I can tell that Z is in a strong uptrend. Z has been soaring since July 2020, with a deep and long pullback in Oct 2020.
Let’s have a look at the candlestick chart of Z.
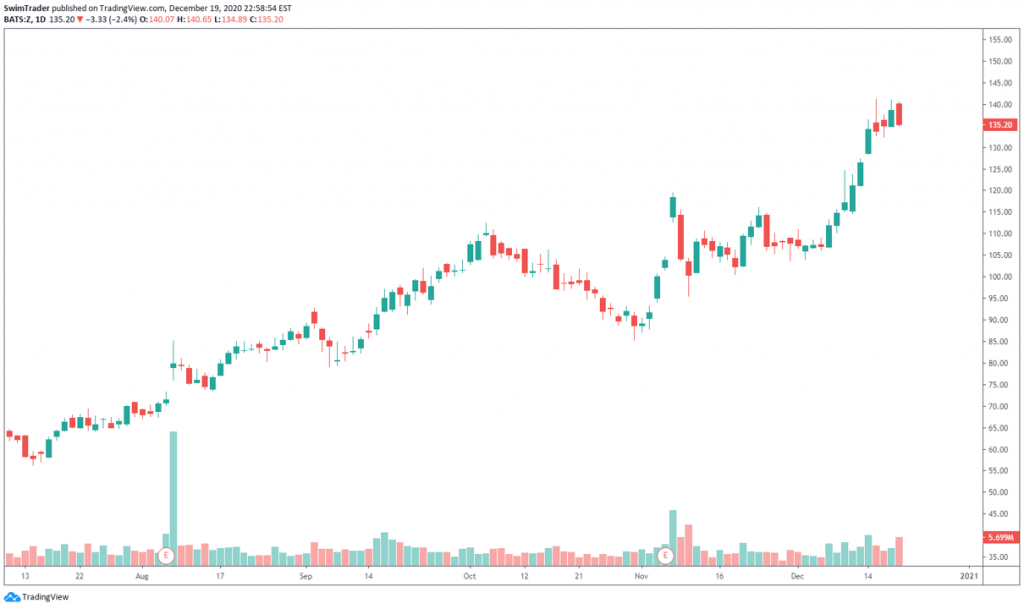
Here, you can also tell that Z is in a strong uptrend from July 2020, with the exception of Oct.
As candlesticks display the Open, Close, High, and Low of each trading session, you are provided with rich details. There are more details which you can infer and these will be explained in the next section.
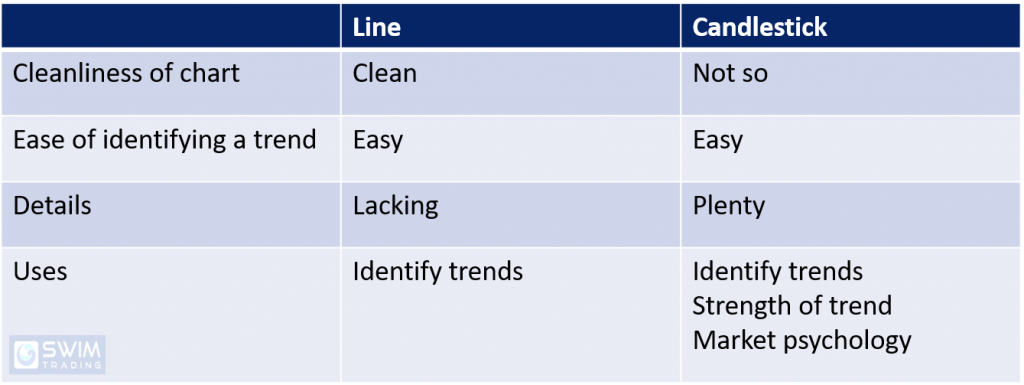
Before we move on to the next section, the table below shows the key differences between a line and candlestick chart.
#3 How To Read Candlesticks?
Candlestick charts are rich in details. From the table above, candlestick charts can help you identify trends, the strength of trends, and the psychology of all market participants. These make candlestick charts so much more valuable than line charts.
How? You can infer the strength of a trend through the size of the candlestick’s body.
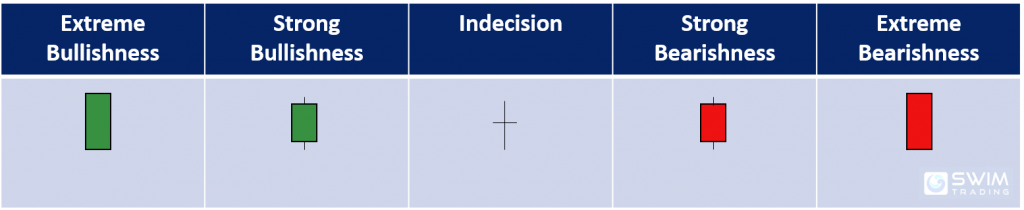
When the body of a candlestick is green, it is bullish. The larger the body of a green candlestick, the stronger the bulls are in that trading session.
The same applies to the bearish candlesticks.
When there is a tie between the bulls and the bears, the candlestick may have a tiny or non-existent body. Such a candlestick can have short or long wicks.
Let’s look at the candlestick chart of Z and see how this applies.
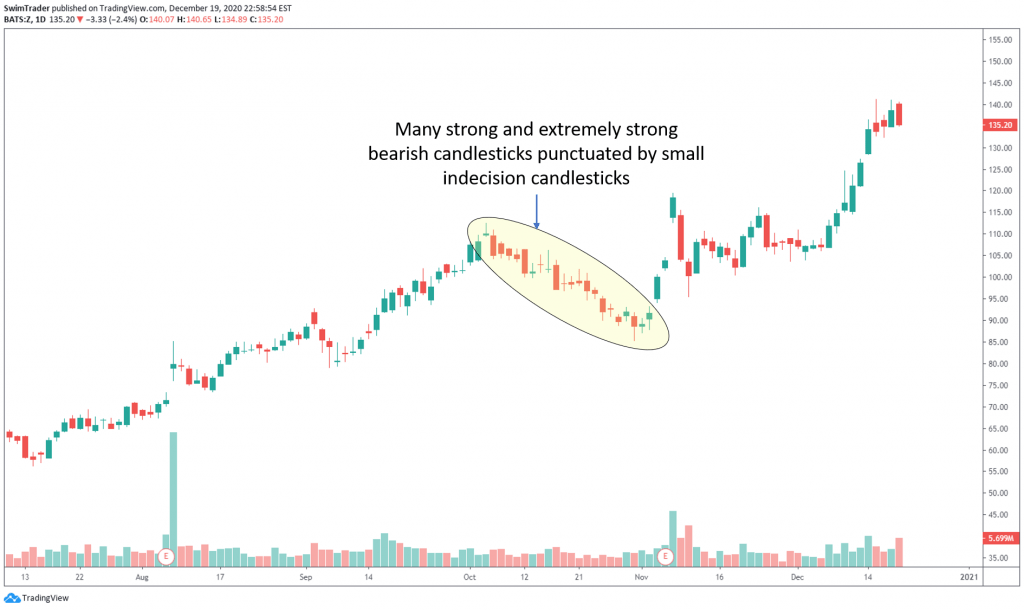
There’s a deep pullback of Z in Oct 2020. There were many huge bearish candlesticks which signified that the bears were extremely strong. Indecision candlesticks appeared in between the huge bearish candlesticks, but the pullback continued.
As the bears were strong, it would not be wise to buy against the trend. You’ll never know how much more Z can drop by. In addition, swing trading is based on trend following. Therefore, to swing trade successfully, you have to follow the trend.
Want to dive deeper into the characteristics and significance of candlesticks? I have done up 9 articles and you can check them out here.
#4 What Are The Thoughts Of Fellow Traders?
Prices move in waves.
Let’s have a look at the various swings in the chart of Z.
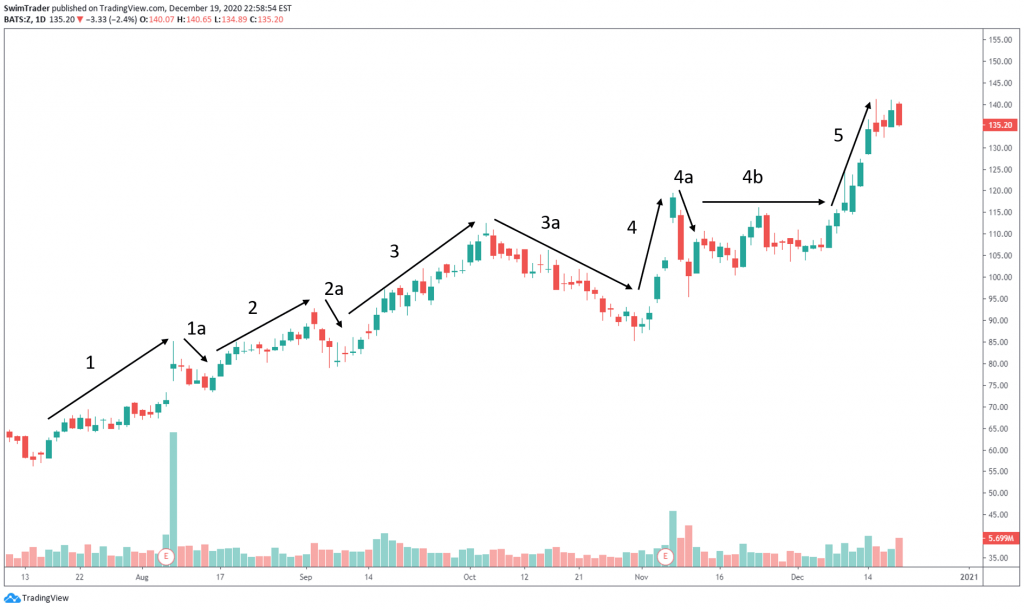
Remember that a swing in a bull market is an uptrend? The swings are noted as 1, 2, 3, 4, and 5.
The pullbacks are 1a, 2a, 3a, and 4a. 4b shows a consolidation.
Did you notice that there are more bullish candlesticks in a swing, and more bearish candlesticks in a pullback?
In a swing, fellow traders are optimistic. Traders and investors think that the stock is cheap or that there is room for the company to continue growing. Hence you’ll see more candlesticks that are in green and they are larger in size compared those in red. Once this optimism and exuberance end, traders start to sell their shares, to realize their profits.
When this happens, you’ll start to see more candlesticks that are in red. They may even have larger red bodies as shown in the chart of Z above. As pessimism grows, the pullback will be deeper and may last for a longer time, such as 3a. The pullback in 3a lasted for a month, as opposed to those seen in 1a, 2a, and 4a which only lasted for days.
Are you in awe with what candlestick charts can do to help you trade successfully?
Here’s What You’ve Learnt Today
Learning to read and understand candlesticks is critical as they help you identify trends, tell you the strength of trend, and provide valuable insights to the market’s sentiment.
Knowing all the above points will help you avoid buying while prices are falling and when the sentiment of traders is pessimistic. This will protect your trading capital as prices fall, and grow your account as prices rise.
Here’s What You Can Do To Improve Your Trading Right Now:
#1 Register for our market outlook webinars by clicking here
#2 Join us in our Facebook Group as we can discuss the various ways of applying this by clicking here
#3 Never miss another market update; get it delivered to you via Telegram by clicking here
#4 Grab a front row seat and discover how you can expand your trading arsenal in our FREE courses (for a limited time only) by clicking here
Trade safe!
