The stock that you are looking at is at its all-time high. You are unsure if you should go Long right now. This stock has been exceeding expectations for some months now. Your peers have made their share and you don’t want to be left out. But, you are afraid.
These 2 chart patterns are extremely helpful in predicting reversal of a trend, allowing you to make money. They are the rounding bottom and rounding top.
What’s The Cause Of A Rounding Top/Bottom?
A rounding bottom is caused by growing optimism. Buyers are stepping in. Sellers, on the other hand, are not keen to sell. This results in an increase in price.
A rounding top is caused by growing pessimism. Sellers are stepping in. Buyers, on the other hand, are not keen to buy. This results in a decrease in price.
Spot It Right
#1 Rounding bottom
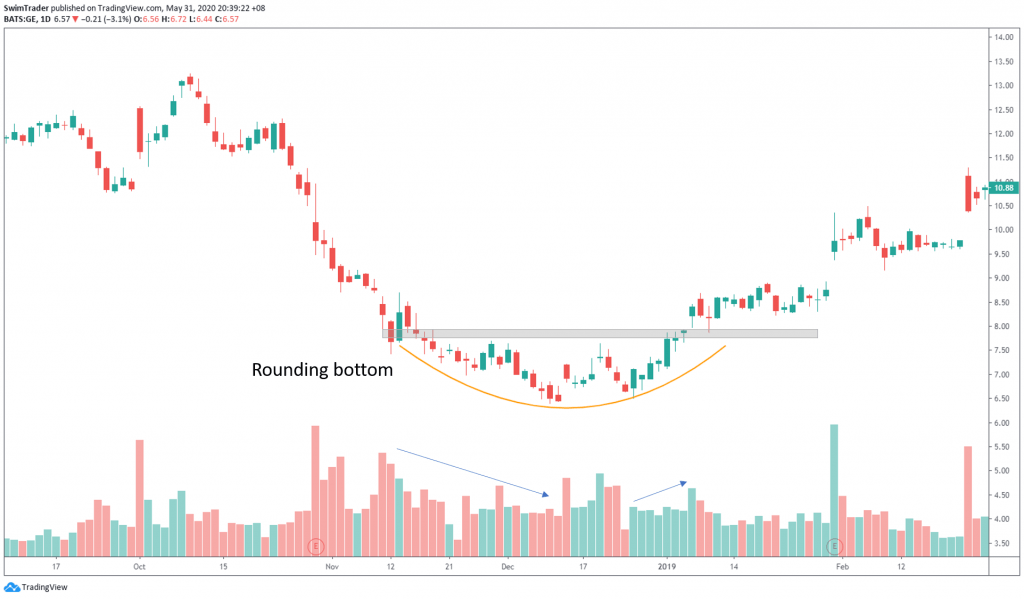
Characteristics:
- Elongated U shape
- Must be formed at a significant low
- Eg. 52 week low, 10 year low
- Volume is lowest at the bottom of the pattern
- Price and volume increase after the bottom
#2 Rounding top
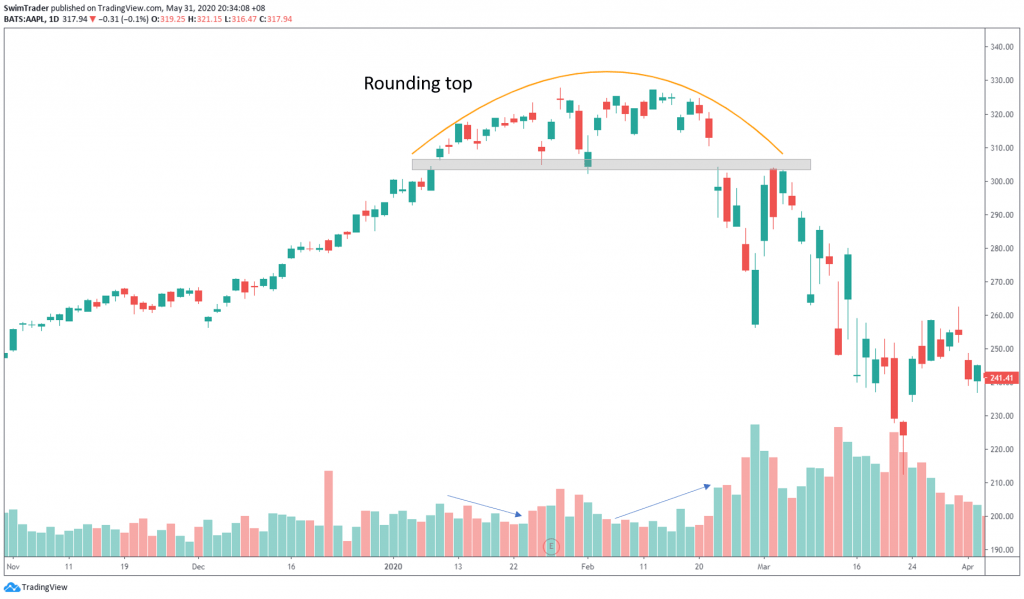
Characteristics:
- Elongated inverted U shape
- Must be formed at a significant high
- Eg. 52 week high, 10 year high
- Volume is lowest at the top of the pattern
- Volume increases after the top as price declines
Show Me The Money
#1 Breakout trade
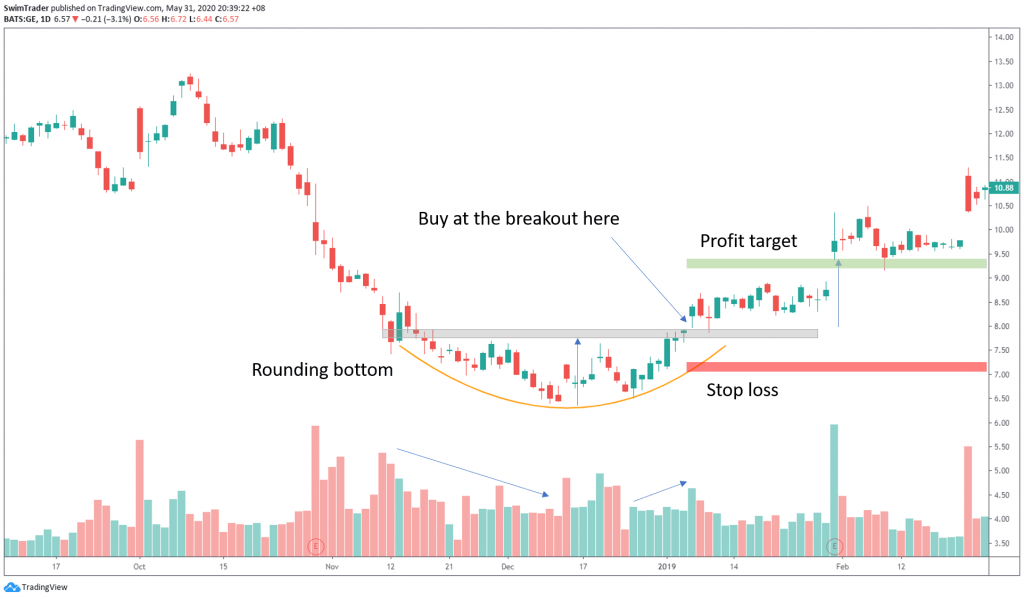
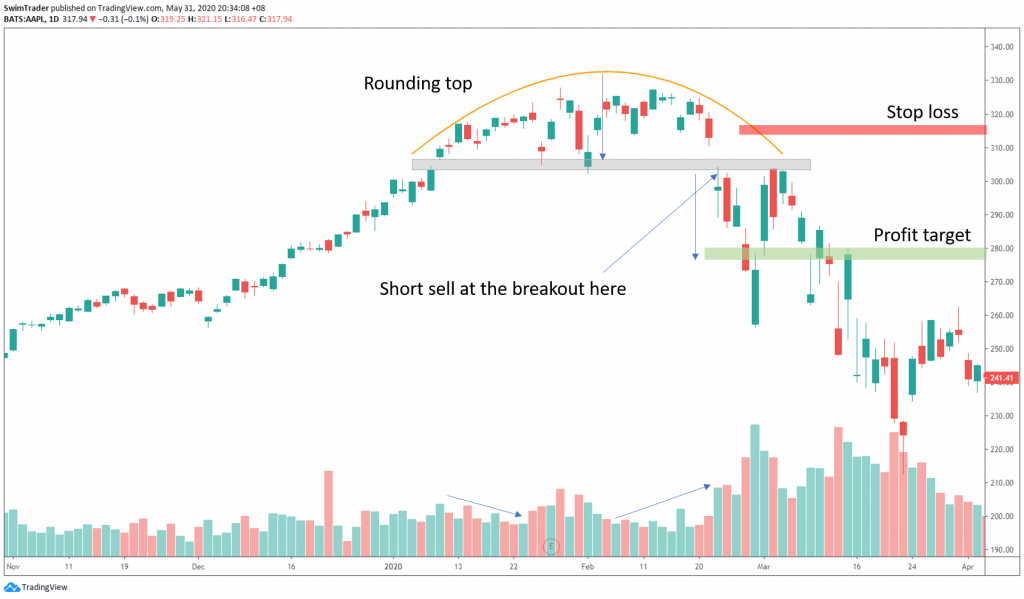
- Watch for price to break the support/resistance zone (shown in grey)
- Enter your position according to the direction of the breakout the next session
- If you are trading using the hourly chart, enter the trade an hour later
- If you are trading according to a daily chart, enter the trade on the next day
- Set your stop loss
- Set a profit target (based on the depth of the chart pattern)
#2 Pullback trade
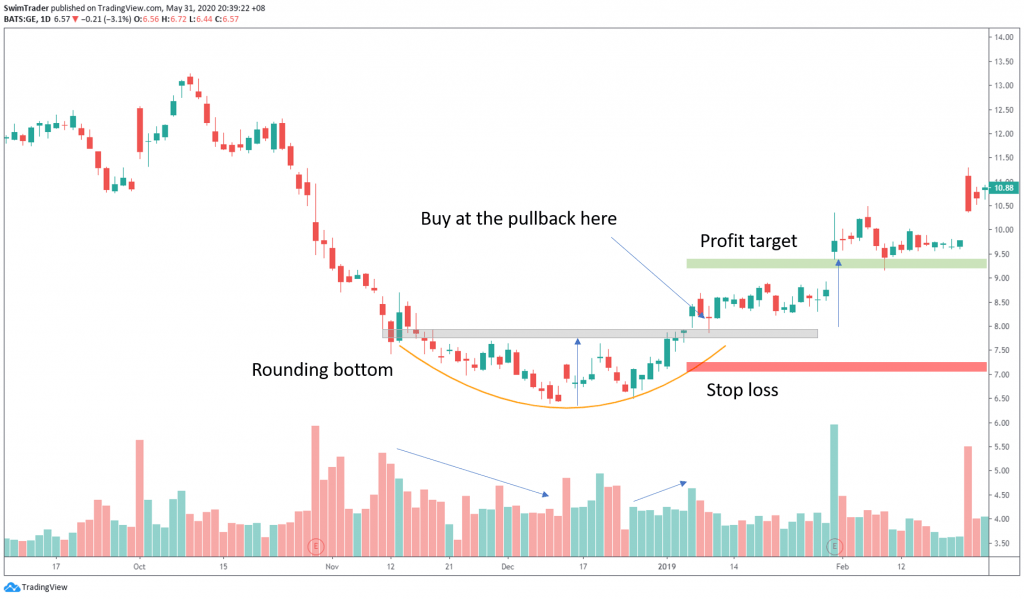
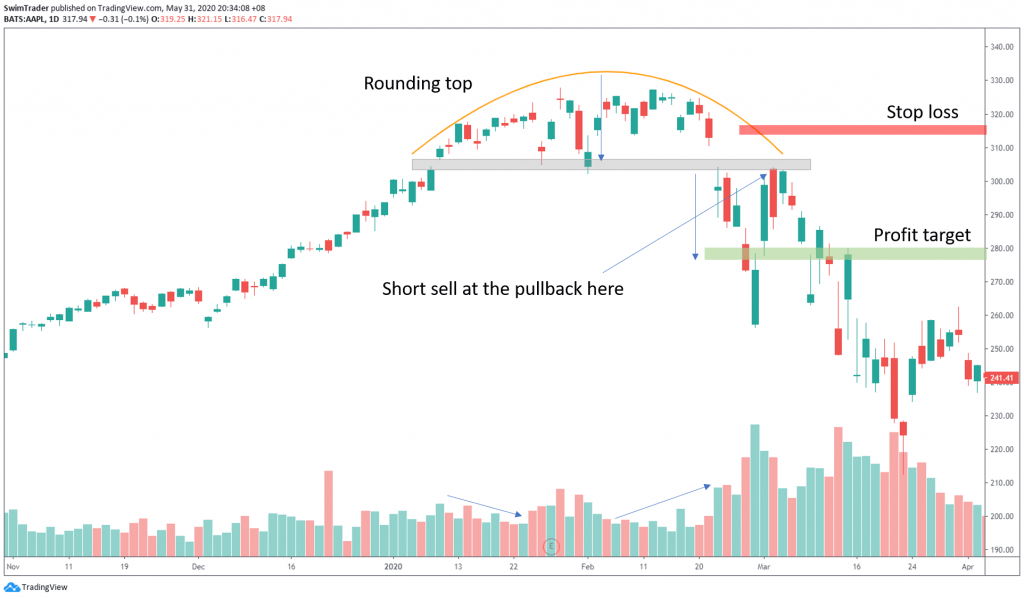
- Watch for price to break the support/resistance zone (shown in grey)
- Wait for the price to pull back to the area near the zone and enter your position the next session
- If you are trading using the hourly chart, enter the trade an hour later
- If you are trading according to a daily chart, enter the trade on the next day
- Set your stop loss
- Set a profit target (based on the height or depth of the chart pattern)
Conclusion
These 2 chart patterns can predict an impeding reversal (change in trend). This prevents you from buying/short selling a stock when you should be waiting to do the opposite.
As illustrated, under the right conditions, trading them can be highly profitable.
Here’s What You Can Do To Improve Your Trading Right Now:
#1 Register for our market outlook webinars by clicking here
#2 Join us in our Facebook Group as we can discuss the various ways of applying this by clicking here
#3 Never miss another market update; get it delivered to you via Telegram by clicking here
#4 Grab a front row seat and discover how you can expand your trading arsenal in our FREE courses (for a limited time only) by clicking here
Trade safe!

