The market crashes and quickly reverses. You don’t know if it is safe to enter the market just yet. You stay on the sidelines while many of your friends are making money from the market.
The market has been running up and you are fearful to enter because the memory of it crashing the moment after you entered is still fresh.
Both situations are unpleasant.
It can be frustrating to be missing out on profits during the initial huge move of a market reversal. You would want to enter the market earlier than most participants. And when the crowd starts entering the market, you can smile at them because you are already in the green.
How? How do you know when to enter to avoid getting wiped out? Look out for the head and shoulders chart pattern. When you spot it, you can be confident that a reversal is on its way.
Spot It Right
#1 Market Tops
Besides the structure, volume is also critical in assessing the validity.
How should this pattern look like?
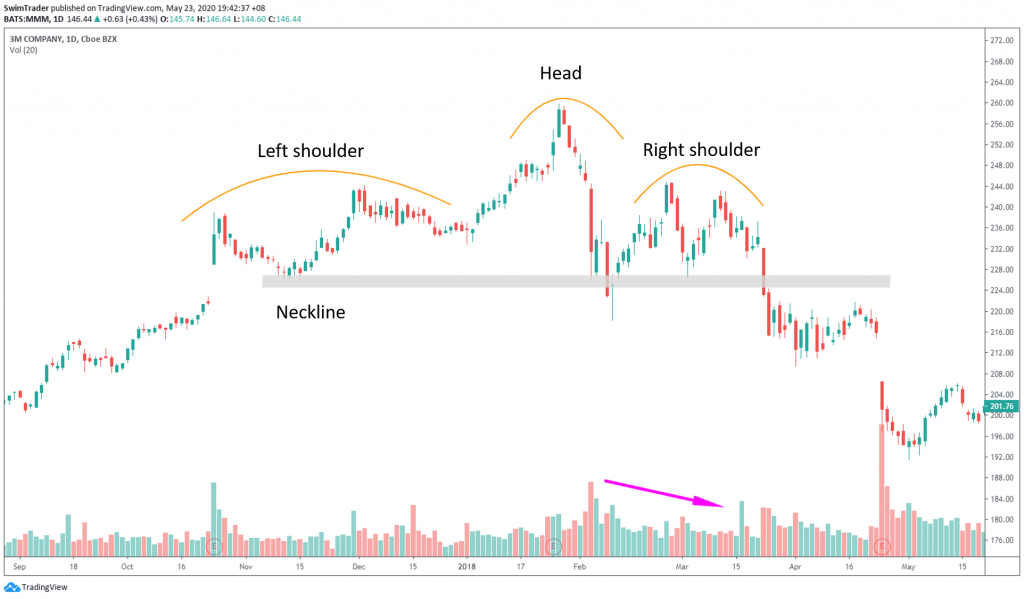
- The “head” (peak) is surrounded by a “shoulder” (lower peak) on each side
- The shoulders don’t have to be equal in height and breadth
- Volume is usually the heaviest at the left shoulder
- Volume continues to be heavy towards the head
- Volume is lower at the right shoulder
- A break in the neckline (you’ll see it in the section Show Me The Money)
#2 Market Bottoms
How should this pattern look like?
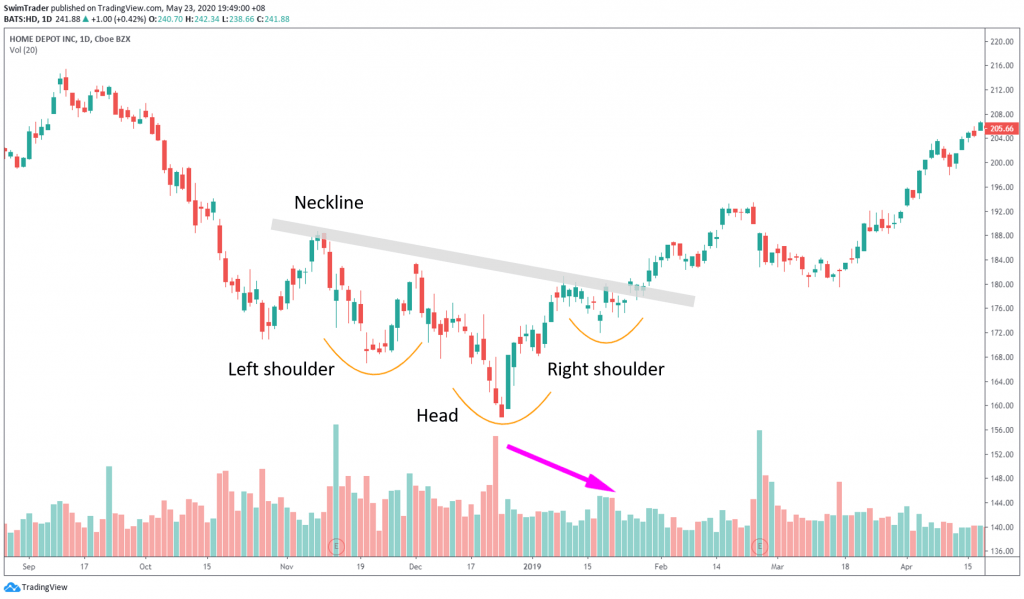
- The “head” (trough) is surrounded by a “shoulder” (shallower trough) on each side
- The shoulders don’t have to be equal in depth and breadth
- Volume is usually the heaviest at the left shoulder
- Volume continues to be heavy towards the head
- Volume is lower at the right shoulder
- A break in the neckline (you’ll see it in the section Show Me The Money)
Show Me The Money
#1 Breakout Trade
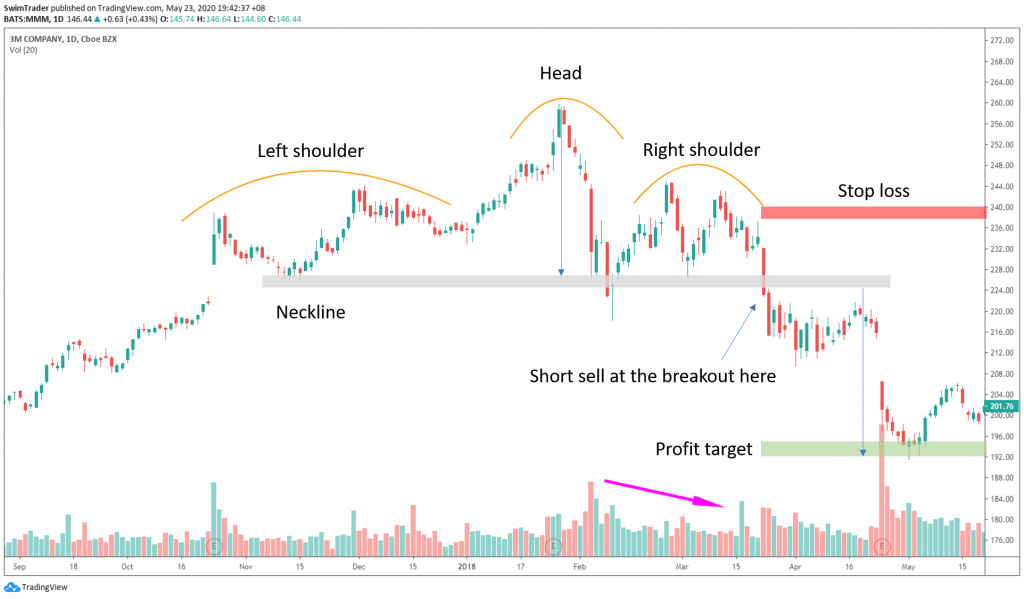
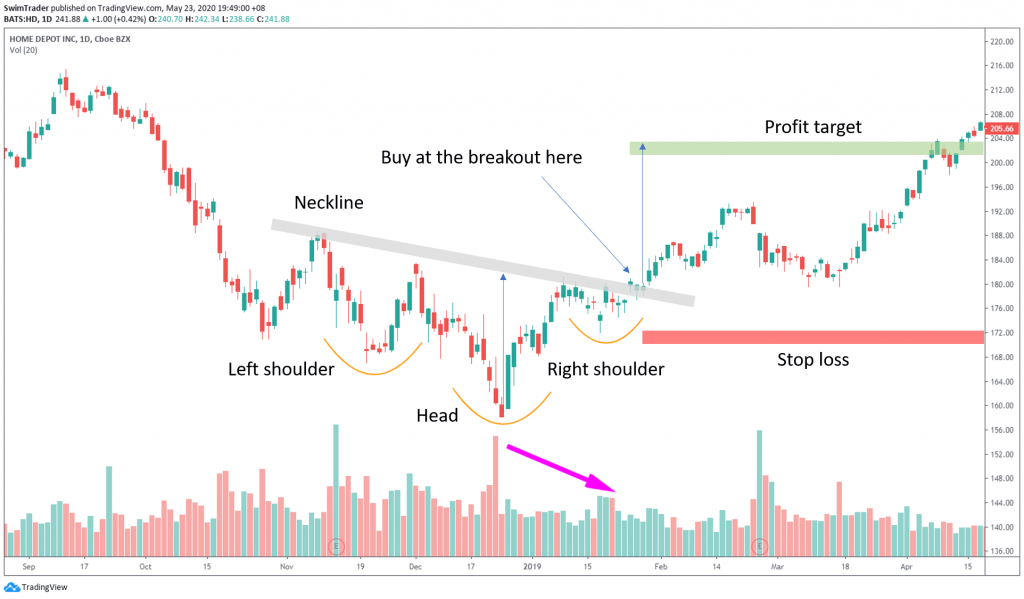
- Watch for price to break the neckline
- Enter your position according to the direction of the breakout the next session
- If you are trading using the hourly chart, enter the trade an hour later
- If you are trading according to a daily chart, enter the trade on the next day
- Set your stop loss
- Set a profit target (based on the height or depth of the head)
#2 Pullback Trade
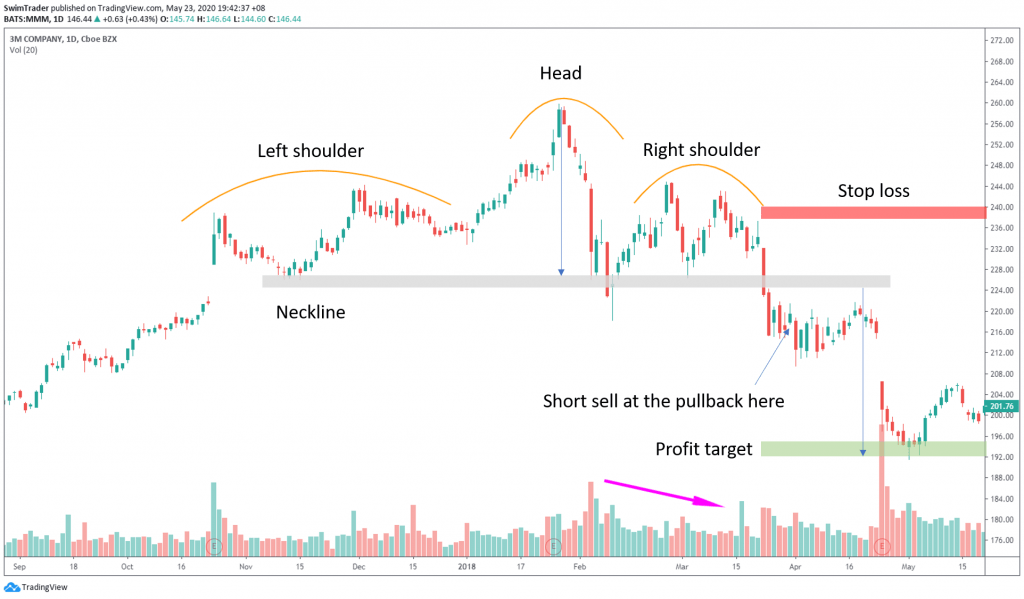

- Watch for price to break the neckline
- Wait for the price to pull back to the area near the neckline and enter your position the next session
- If you are trading using the hourly chart, enter the trade an hour later
- If you are trading according to a daily chart, enter the trade on the next day
- Set your stop loss
- Set a profit target (based on the height or depth of the head)
Conclusion
It pays to wait for prices to form a pattern before entering after a market crash. The first few rallies are usually deceiving.
When the market is rallying and at a significant top, wait for a pattern to be formed to save you from all the agony and losses from buying the top.
Here’s What You Can Do To Improve Your Trading Right Now:
#1 Register for our market outlook webinars by clicking here
#2 Join us in our Facebook Group as we can discuss the various ways of applying this by clicking here
#3 Never miss another market update; get it delivered to you via Telegram by clicking here
#4 Grab a front row seat and discover how you can expand your trading arsenal in our FREE courses (for a limited time only) by clicking here
Trade safe!

